What latest retracement on ALGO’s chart reveals about its future price trend
As the bears refrained from giving up their advantage, Algorand (ALGO) was on the back foot for the last few months. Now, it struggled to topple the long-term 23.6% Fibonacci resistance.
While the buyers are trying to keep up their pressure, the chances of defending the $0.73-support were bright. If this pressure sustains, a retest of the mean (20 SMA) of its Bollinger bands (BB) seemed likely. Following this, the overall market structure would play a vital role to anticipate a patterned breakout possibility. At press time, ALGO traded at $0.7349, down by 3.82% in the last 24 hours.
ALGO 4-hour Chart
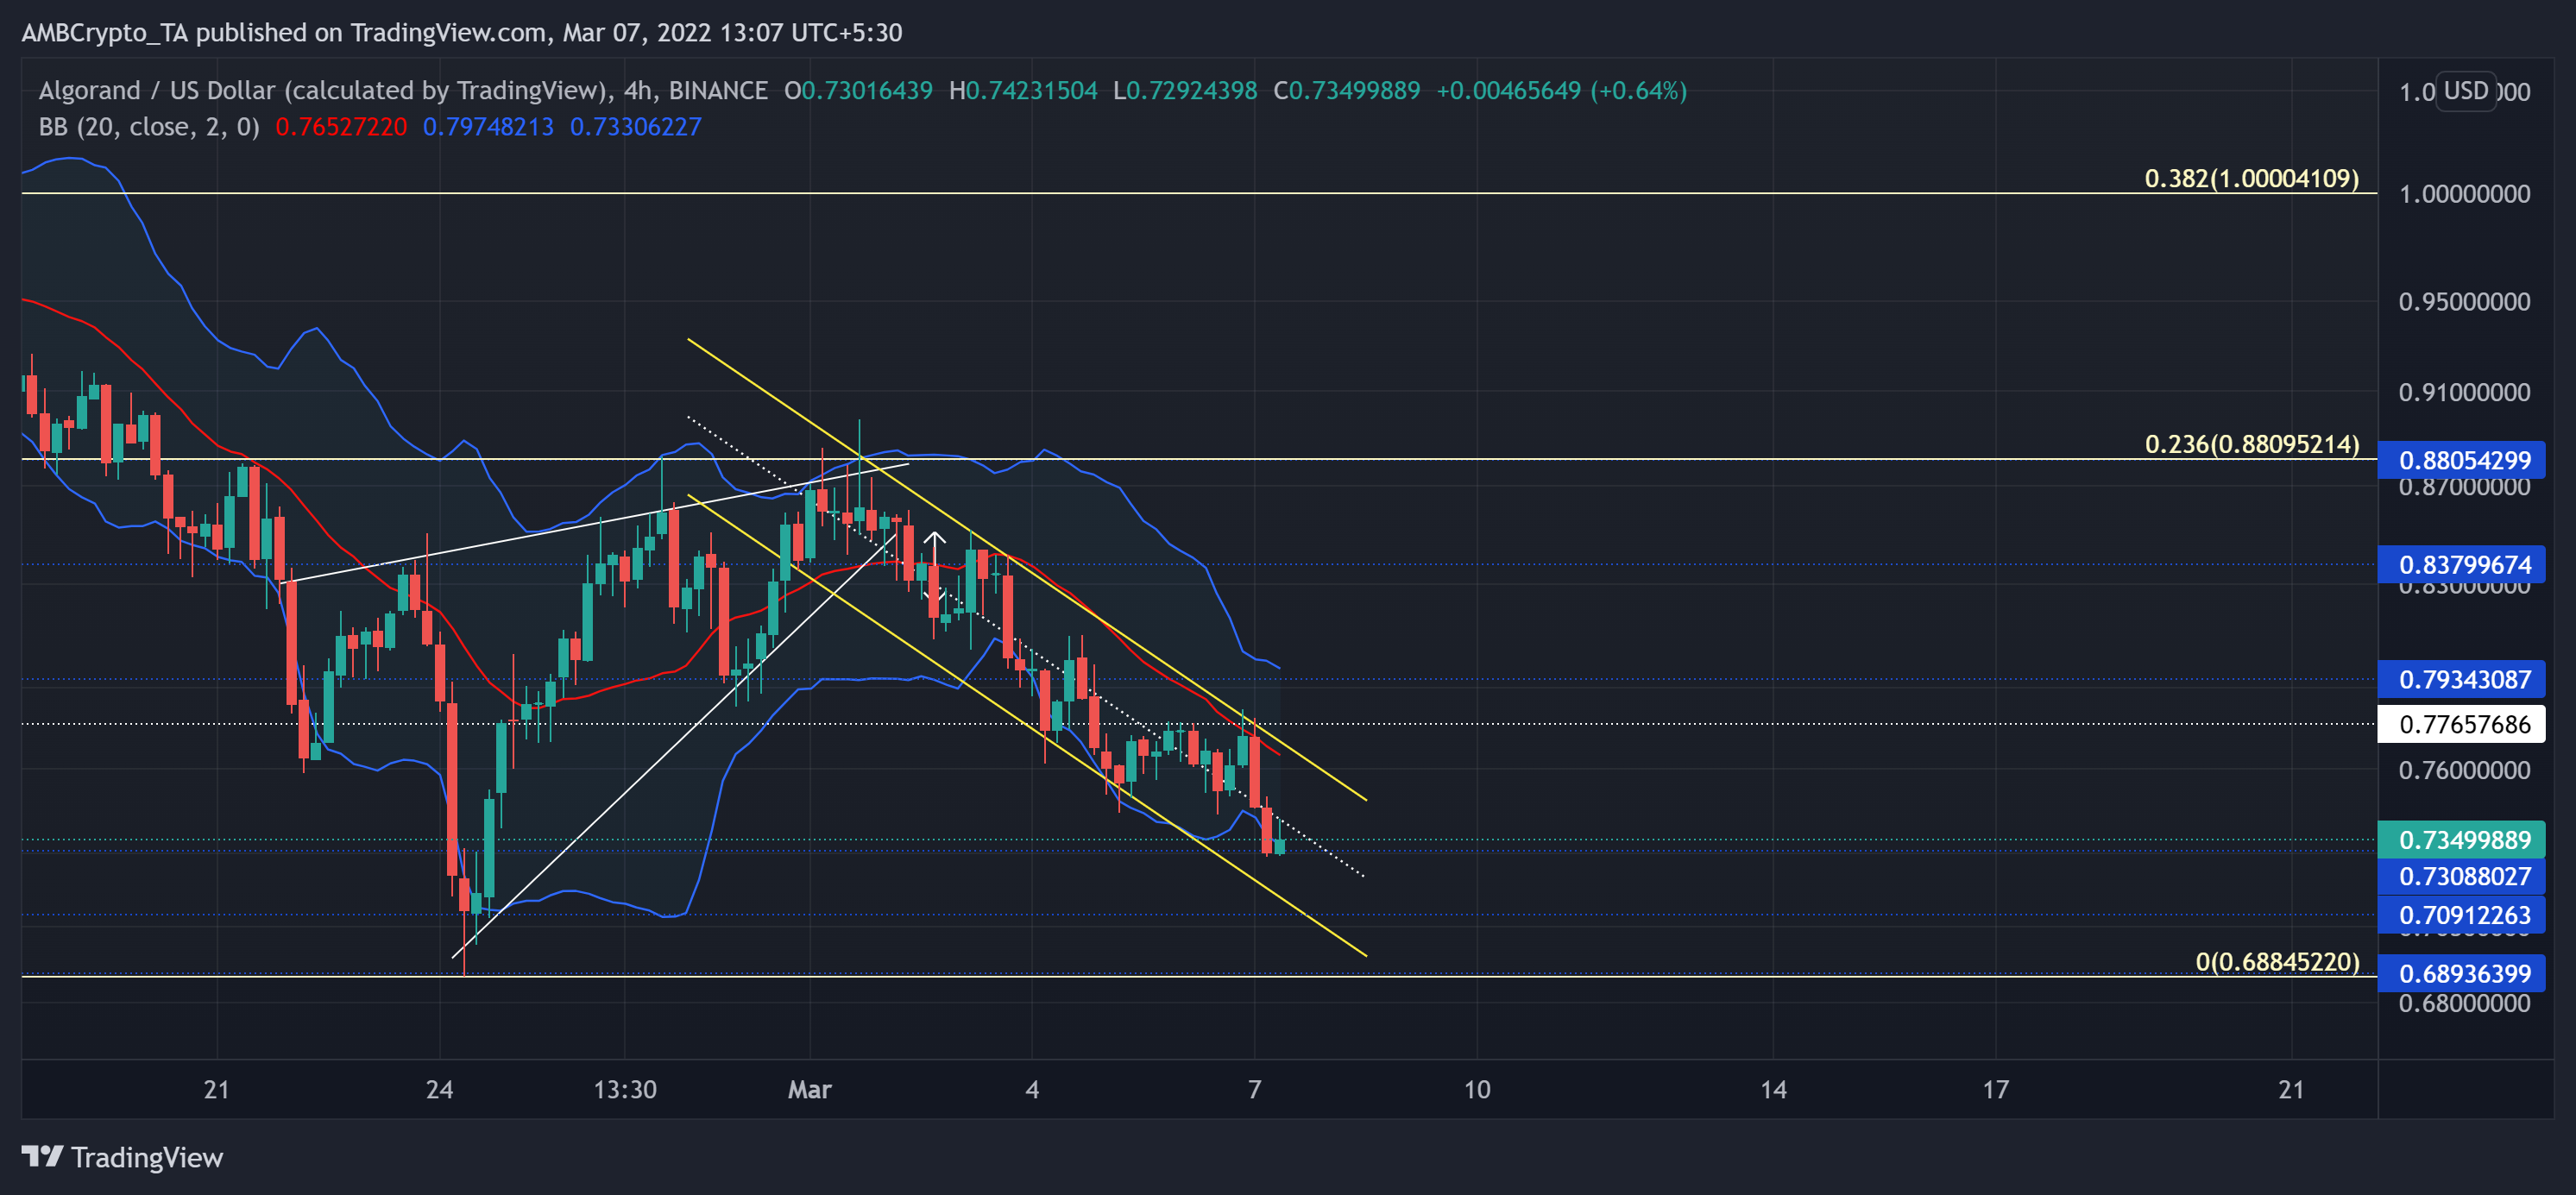
After the bulls struggled to hold their grounds at the $1.8-resistance, ALGO steeply downturned and gravitated towards the $0.7-$0.73 support range. This range has offered a strong floor for over a year now. The alt lost nearly 61.5% of its value (from 5 January) and pulled back towards its seven-month low on 24 February.
Since then, the sturdy 23.6% Fibonacci level shunned all recovery attempts by the ALGO buyers. As a result, the latest retracement saw a sharp pullback between the down-channel (yellow). During this phase, the mean of the BB coincided with the upper trendline of this channel and offered strong resistance. Historically, the bulls have shown a keen interest in defending the current support range. Also, the price has entered into a ‘cheaper’ phase near the lower band of its BB.
From here on, a retest of the $0.76-$0.77 mark before potentially entering into a consolidation phase seemed probable for the alt. Further, most reversals from the $0.7 level found a recovery towards the upper band of the BB.
Rationale
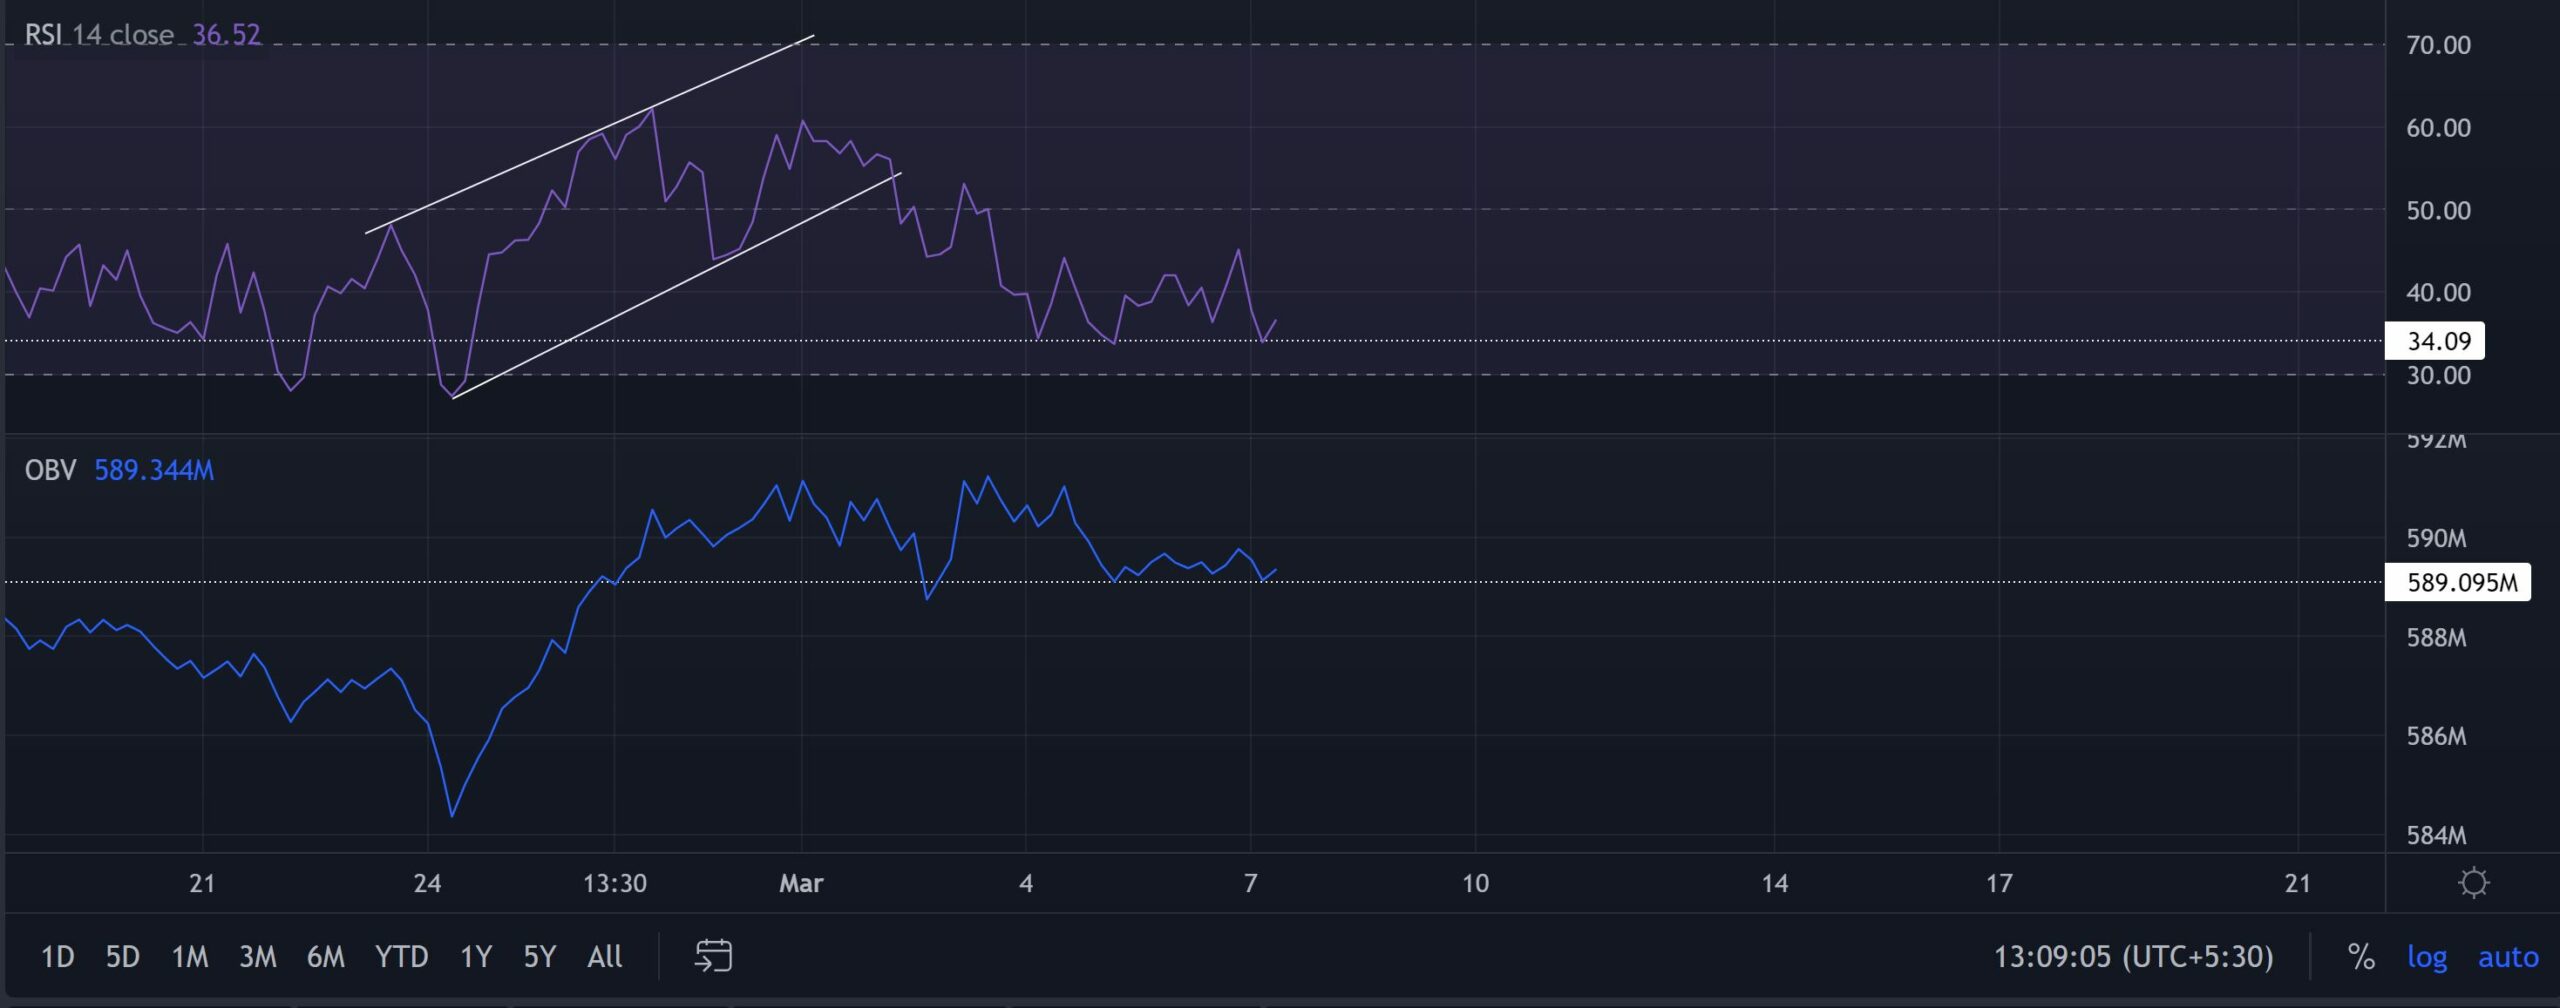
The sellers tested the 34-support thrice in just the last three days. While the buyers maintained the flatter support level on the RSI, the price action marked lower troughs. Thus, revealing a bullish divergence. Similarly, the OBV maintained its immediate support while the price kept falling, conforming to the bullish tendencies in the near term.
Conclusion
The oversold readings on the BB with the divergences on its RSI and OBV made the chances of a near-term bullish comeback bright. But the buyers still needed to ramp up the volumes to find a pattern-breaking sustainable rally. To top it up, the investors/traders should keep a close watch on Bitcoin’s movements as ALGO shares a 74% 30-day correlation with the king coin.