What Litecoin’s 2024 prediction holds as price sits at $72
Litecoin’s price chart had a bullish pattern, suggesting a rally in coming days.

- LTC’s price moved marginally over the last 24 hours.
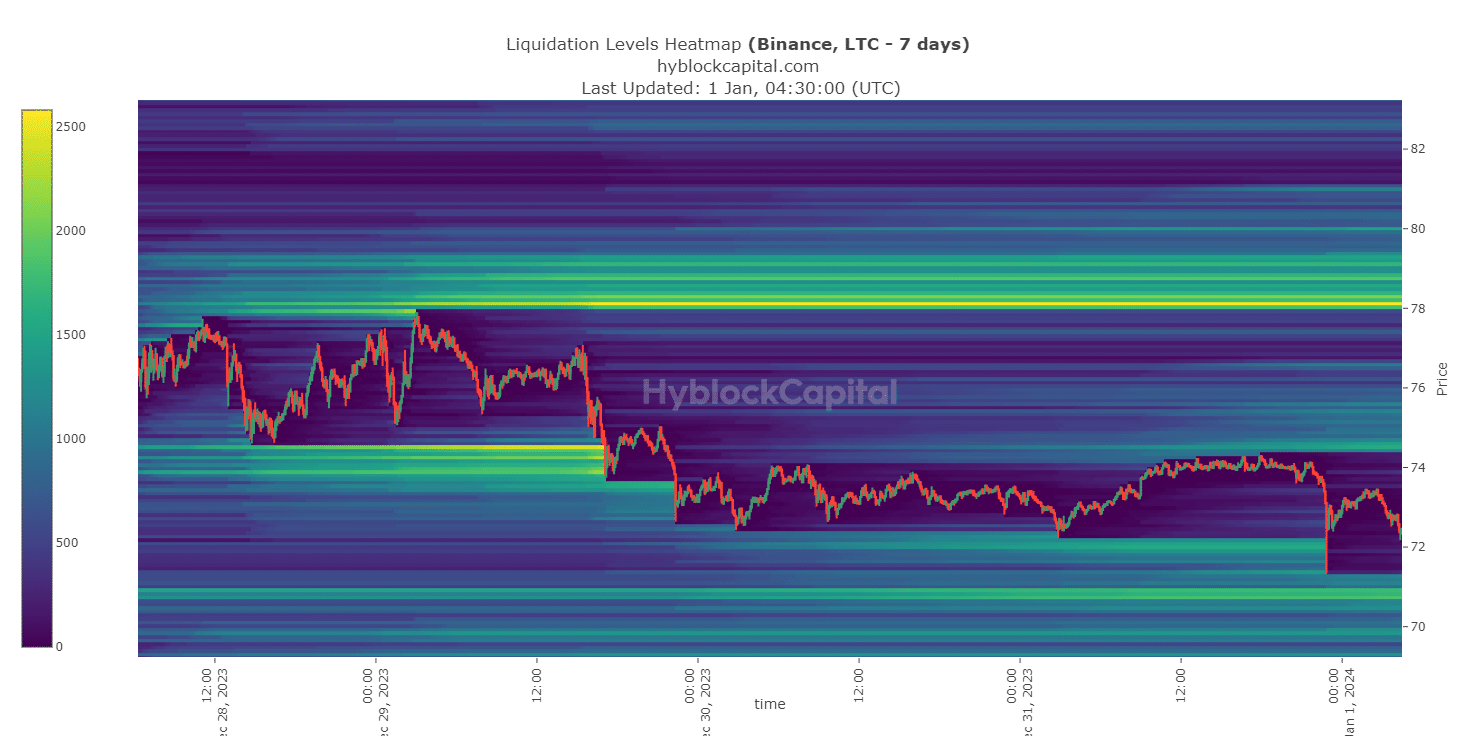
- Litecoin faced massive liquidation near the $77.8 mark.
Litecoin’s [LTC] price is resting at a key level that could cause a price rally as 2024 starts. Therefore, AMBCrypto examined LTC’s on-chain data to better understand whether investors should expect a bull run.
Is Litecoin expecting a bull rally?
According to CoinMarketCap, Litecoin’s price action took a somewhat sideways path, as its price moved marginally in the last 24 hours.
At the time of writing, LTC was trading at $72.52 with a market capitalization of over $5.3 billion, making it the 18th largest crypto. However, if the latest dataset is to be considered, the trend might change as it suggests a price uptick.
As per the tweet, January seemed like a great time for Litecoin to start moving towards its network value model. The coin’s price was at a point where, historically, LTC had begun promising bull rallies.
January seems like a great time for litecoin to start moving towards its network value model. Litecoin price now at the apex of this triangle. The last two times this happened litecoin entered into the bull market phase.$LTC #Litecoin pic.twitter.com/0UYHxd2klv
— mstr (@MASTERBTCLTC) December 31, 2023
What to expect from LTC
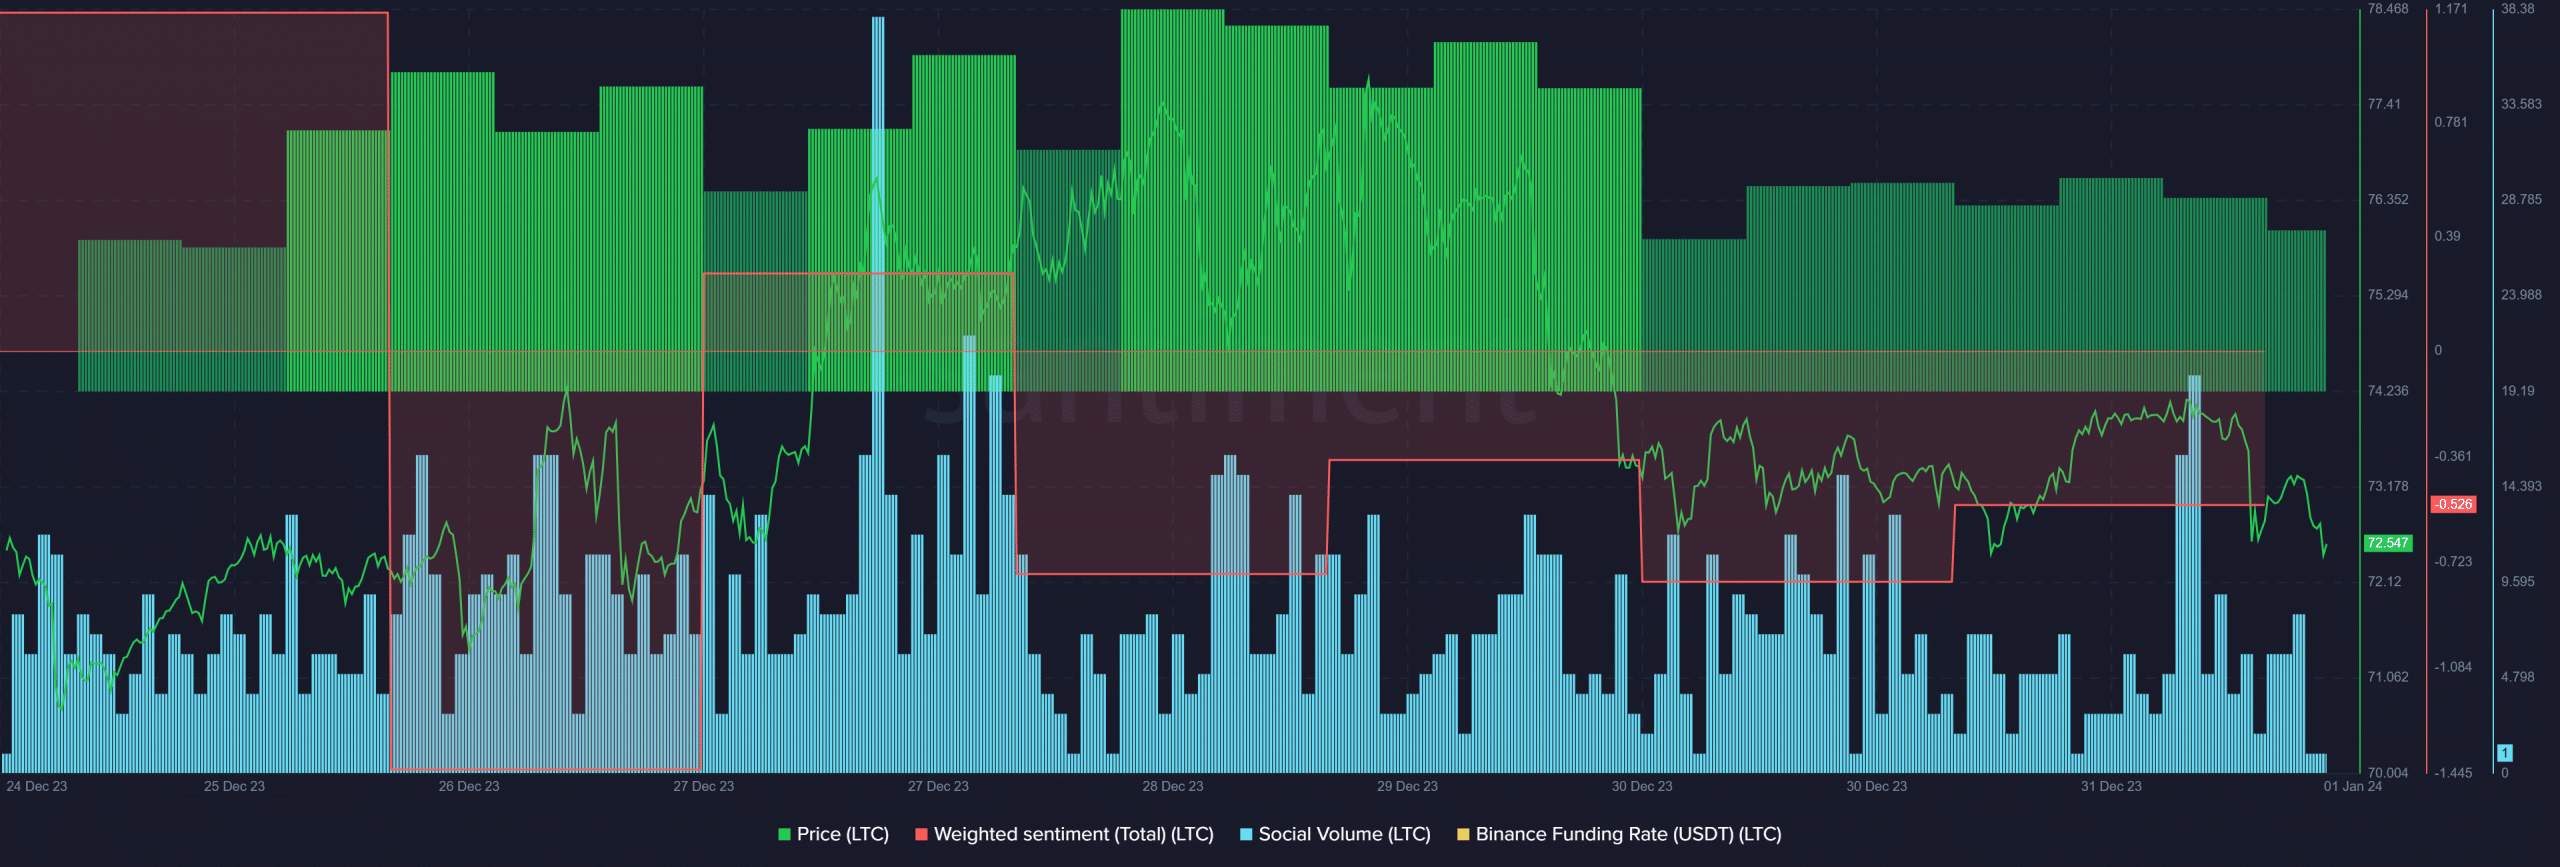
To better understand the viability of Litecoin going above, AMBCrypto checked LTC’s on-chain data. Our analysis revealed that bearish sentiment around Litecoin increased over the recent past, as evidenced by the drop in its Weighted Sentiment.
Its Social Volume also dropped, reflecting a decline in the coin’s popularity. However, its Funding Rate remained green, meaning that derivatives investors continued to buy LTC.
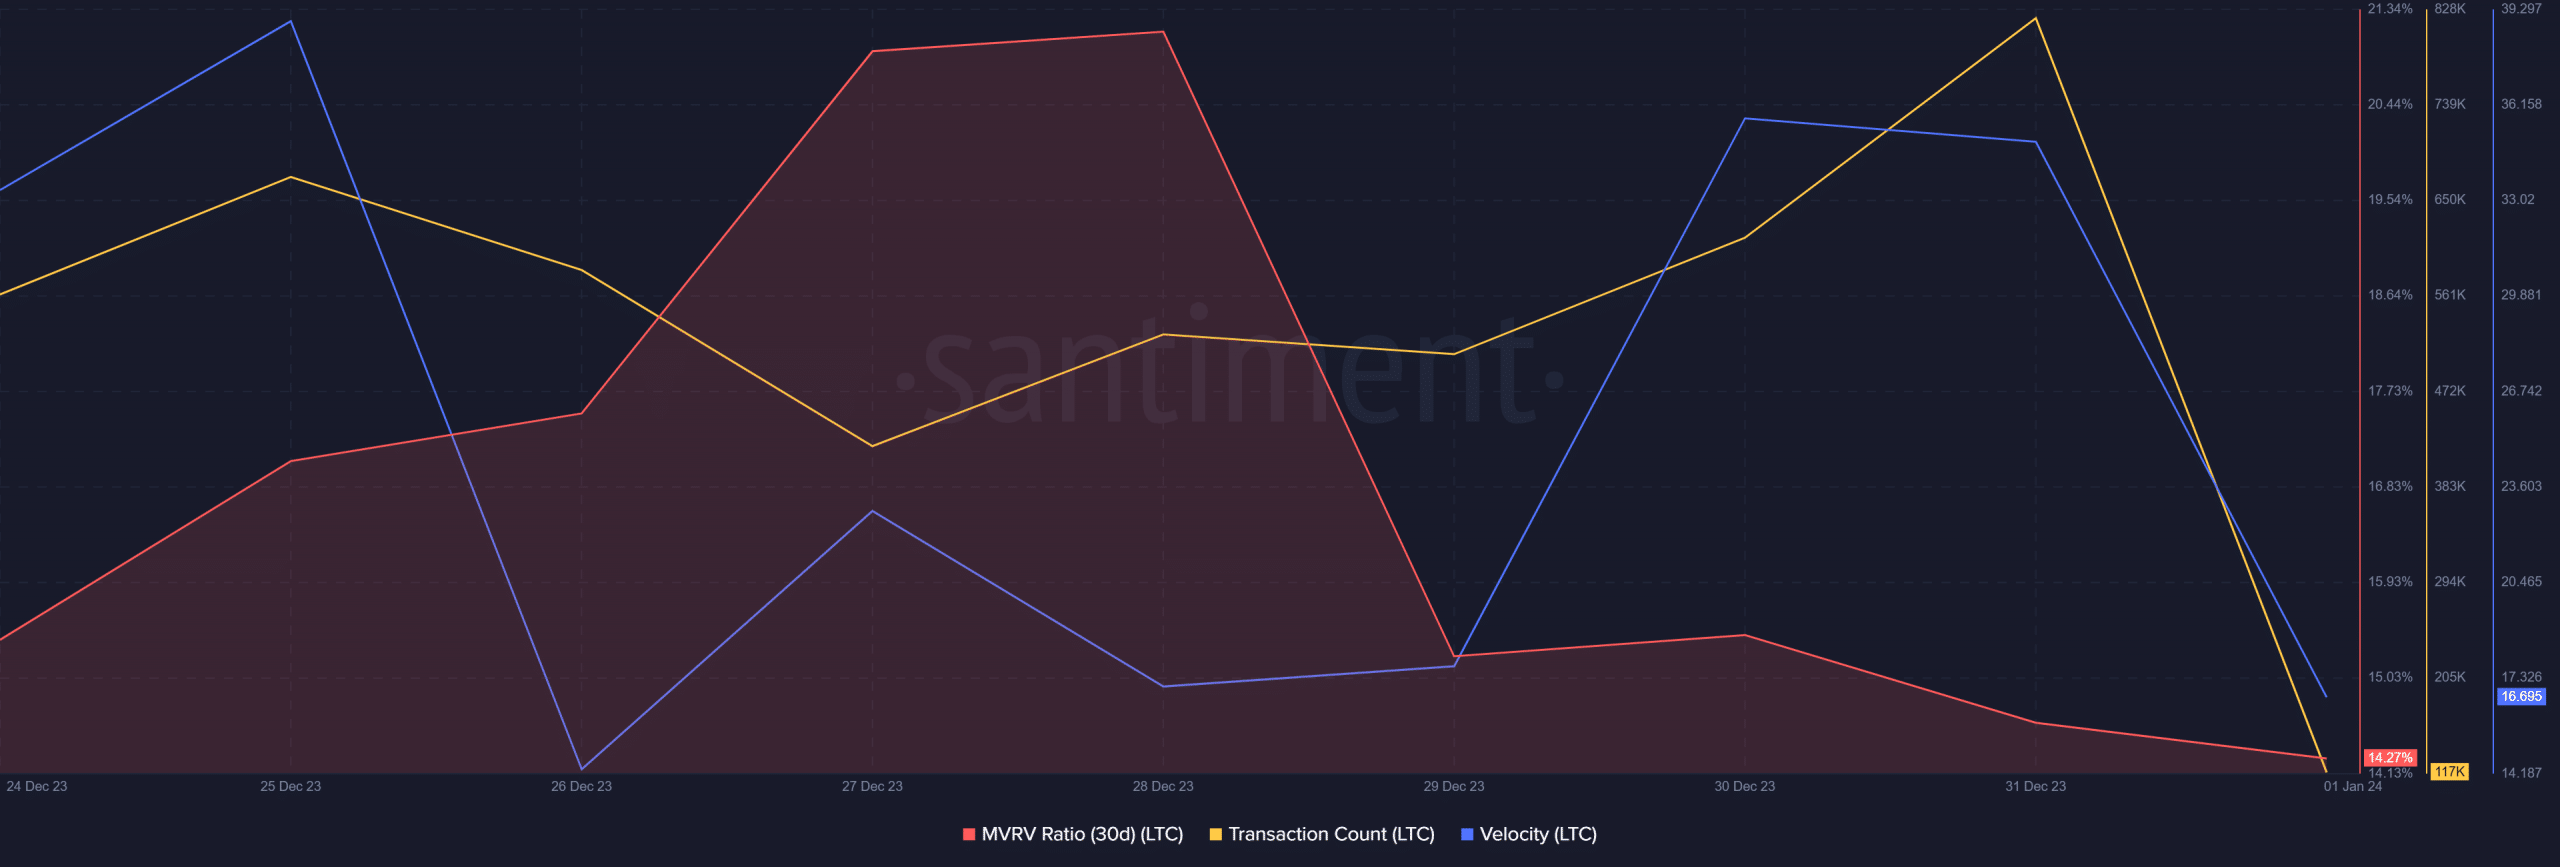
While social sentiments remained low, Litecoin’s MVRV ratio declined, which could be interpreted as a bearish signal. Nonetheless, LTC’s transaction count remained high.
The same was true for the coin’s velocity, meaning that LTC was used in transactions more often within a set time frame.
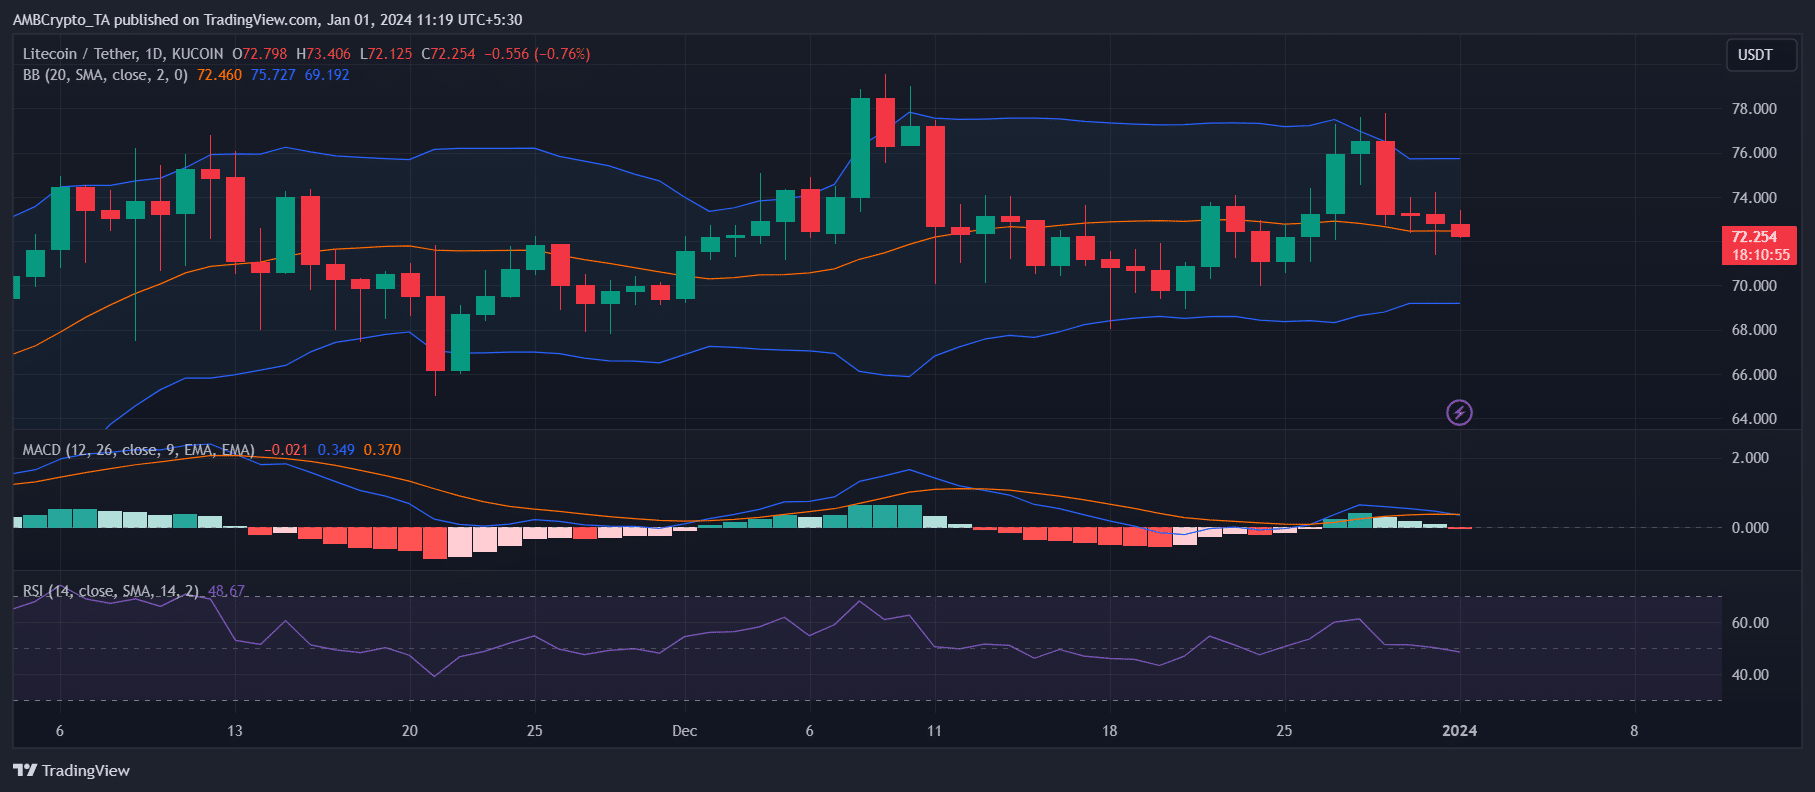
AMBCrypto’s look at LTC’s daily chart revealed that its MACD displayed a bearish crossover at press time. Notably, its Relative Strength Index (RSI) rested near the neutral mark of 50.
On top of that, its Bollinger Bands suggested that LTC’s price entered a less volatile zone, decreasing the chances of an unprecedented uptick in the near term.
Read Litecoin’s [LTC] Price Prediction 2023-24
However, even if Litecoin manages to kick-start a bull rally, it has to overcome a barrier to maintain its gains. AMBCrypto’s look at Hyblock Capital’s data pointed out that Litecoin witnessed massive liquidation near the $77.8 mark.
Therefore, even if LTC starts a bull rally, it must go above that level for investors to enjoy profits in the coming days.