What these signs indicate about Fantom crossing the $2-mark

Fantom has had a stellar performance over the last month after witnessing a period of stagnation in mid-September. A near 100% hike in valuation during the second week of October accelerated FTM’s performance as the alt smashed past the $2-mark and set new records.
However, as FTM overcame new milestones each week, some signs of exhaustion were beginning to catch up to the alt’s current bull run.
Bearish divergences along the RSI and an unfavorable crossover on the MACD suggested that FTM could take a step back before commencing the next upwards run. At the time of writing, FTM traded at $2.32, down by 6.2% over the last 24 hours.
Fantom 4-hour Chart
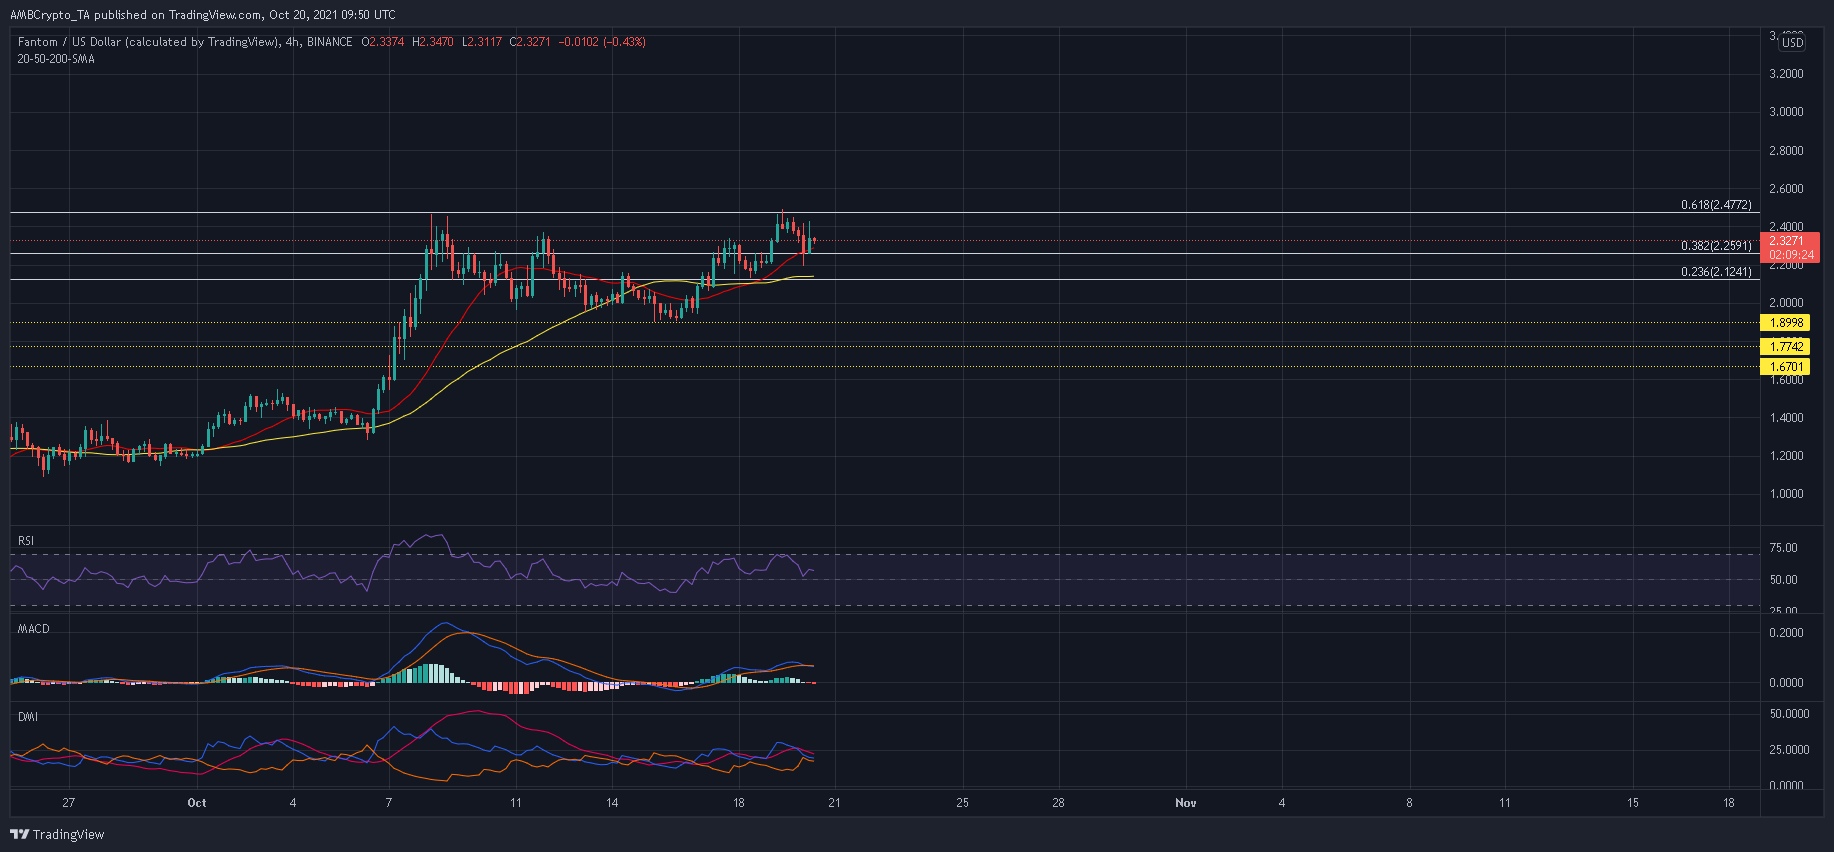
A few market uncertainties were creeping into the market after Fantom was unable to scale past the 61.8% Fibonacci Extension of its 15 October low. A double top around $2.46 induced some selling pressure as investors cashed out on FTM’s staggering rally.
If bears are able to cut below the confluence of the 50-SMA (yellow) and 23.6% Fibonacci Extension, the market would be exposed to a drawdown towards the neckline at $2. A close below this neckline can culminate into a 12% sell-off.
Overall, these losses would represent a near 30% drawdown from FTM’s press time level. Meanwhile, buyers can look to punch back the $1.67 and $1.77 support levels.
Reasoning
Now, even though FTM snapped two peaks at the 61.8% Fibonacci Extension, the RSI moved formed lower highs and inched towards the half-line. This bearish divergence indicated that the RSI did not conform with FTM’s price action and potential retracement was shaping up in the market.
Secondly, the MACD’s witnessed its first bearish crossover in 11 days- a sign that bulls were gradually losing momentum. Similarly, the Directional Movement Index was also on the cusp of a bearish crossover as the -DI line inched closer to the + DI line.
Conclusion
FTM stared at the barrel of a near 30% decline after forming a double top at around $2.46. This pattern was compounded by bearish signs along the MACD, RSI and DMI as well. Over the near-term, FTM could make its way to the $2-mark, from where $1.67 and $1.77 support would be under the limelight.


