Disclaimer: The findings of the following analysis are the sole opinions of the writer and should not be considered investment advice
Bitcoin Cash reaped the benefits of a bullish broader market of-late. Its value rose from its late-July lows of $384 to a local high of $805 – A near 110% increase in less than 2 months. Hence, an argument can be made that its daily drop of 14% on 7 September was actually healthy over the longer run.
However, there are a few risks in the market. For instance, the formation of a symmetrical triangle did carry some threats of additional losses.
For buyers, a close above an important zone would instill some confidence in the market. At the time of writing, Bitcoin Cash was trading at $666.5, up by 1.4% over the last 24 hours.
Bitcoin Cash 4-hour Chart
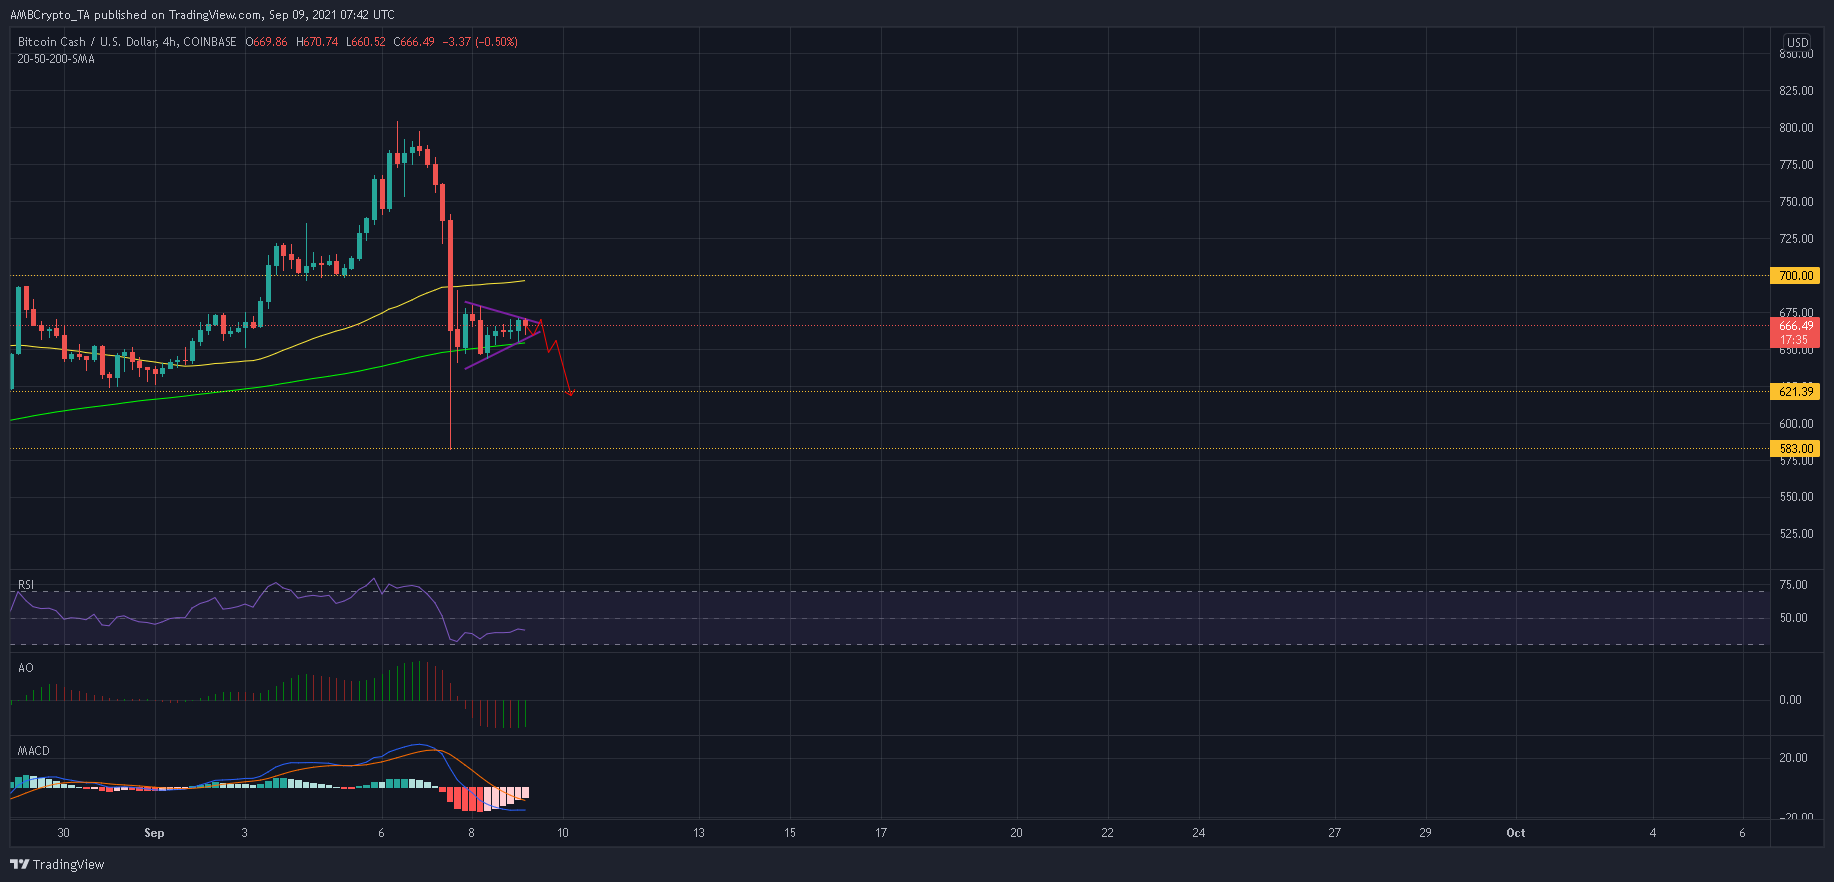
Source: BCH/USD, TradingView
BCH snapped an unwanted milestone once the price declined by 14% a couple of days ago. Such a drastic move was last observed on 21 June, after which BCH hit a near 5-month low at $385. As the dust settled after BCH’s latest drop, lower highs and higher lows gave rise to a symmetrical triangle.
The pattern normally holds equal chances of a breakout in either direction, but since the prior trend was bearish, the pattern can be expected to play out as a continuation of the same. In this case, a breakdown would be confirmed once BCH slips below its 4-hour 200-SMA (green).
The $621 price level has been active since mid-August and posed as the first area of defense. Moreover, the $583 support would take the center stage if selling pressure is not abated instantly.
To trigger a favorable outcome, buyers would look to step in at the 4-hour 200-SMA. From there, a close above $700 would account for the best-case scenario.
Reasoning
As BCH took shape in a symmetrical triangle, most of its indicators looked to steady ship. The Awesome Oscillator and MACD eyed a move towards each of their respective lines as some buying pressure trickled into the market. This was expected since the price does stabilize within the aforementioned pattern before a breakout.
However, the RSI still maintained its bearish nature and traded below 45. This indicated that there was weakness in the market – Something that sellers could capitalize on going forward.
Conclusion
Bitcoin Cash’s symmetrical triangle can be expected to trigger a southbound move on the charts. In such a scenario, buyers could look to step in at $621 or lower down at $583, depending on how severe the next wave of selling pressure is.
On the other hand, the best-case outcome for buyers would be to enforce a close above $700 from the 4-hour 200-SMA (green).