
Even though an all-over bullish rally is still evident on the king coin’s one-day price chart, Bitcoin faced a major consolidation at the $47,250 level. The same raised concerns among investors about its rally.
What Next
At this point though, the good news is that Bitcoin is still rallying. But for BTC’s price to continue on this bullish path, it is imperative to assess circulating supply metrics to understand the future flow of the market.
Bitcoin has managed to climb above the $47K level after a short trip to the $30K level, less than a month ago. Now, as the largest coin is about to close in the green on the weekly chart for four consecutive weeks, speculations are running high. Here, looking at this revival rally through the lens of certain metrics can present a clearer picture of the trend forward.
Price action continues to be bullish
On the daily chart, Bitcoin closed in green for the last four days and traded at $47.2K at press time. However, after BTC’s price rejected resistance at $48,000 on August 14, optimism about the king coin crossing over the level seemed to fade. Nonetheless, BTC has managed to hold ground. In fact, as highlighted by Rekt Capital, Bitcoin managed to successfully retest the top of the Ascending Triangle as support, two days in a row.

Source: Rekt Capital
However, Bitcoin’s price on the one-day chart seemed to be making a rising wedge pattern which was indicative of upside momentum waning. This was a sign of bullish-to-bearish trend change but the fact that BTC found solid support on an ascending triangle said otherwise. Amid more bullish signals than bearish, price-wise the coin’s trajectory looked largely neutral, tipping a little towards the bullish side.
These metrics need to align
Bitcoin’s Average Spent Output Lifespan (ASOL) and Median Spent Output Lifespan (MSOL) highlighted a massive divergence. Notably, ASOL (30day), which in simple terms, is the average age of spent transaction outputs, highlighted an uptick.
ASOL levels at the time of writing were at an all-time-high level which was last seen in February. On the contrary, MSOL registered a downtick and saw all-time low levels last seen in March.
The ASOL metric can be extremely important to identify old coins that were created before and whether they are moving in the network. A rise in the metric signified that old coins were on the move, as it brings up the average. Further, MSOL tracks coins with middle-age or supply (day-to-day traffic), which was lowest for BTC since March.
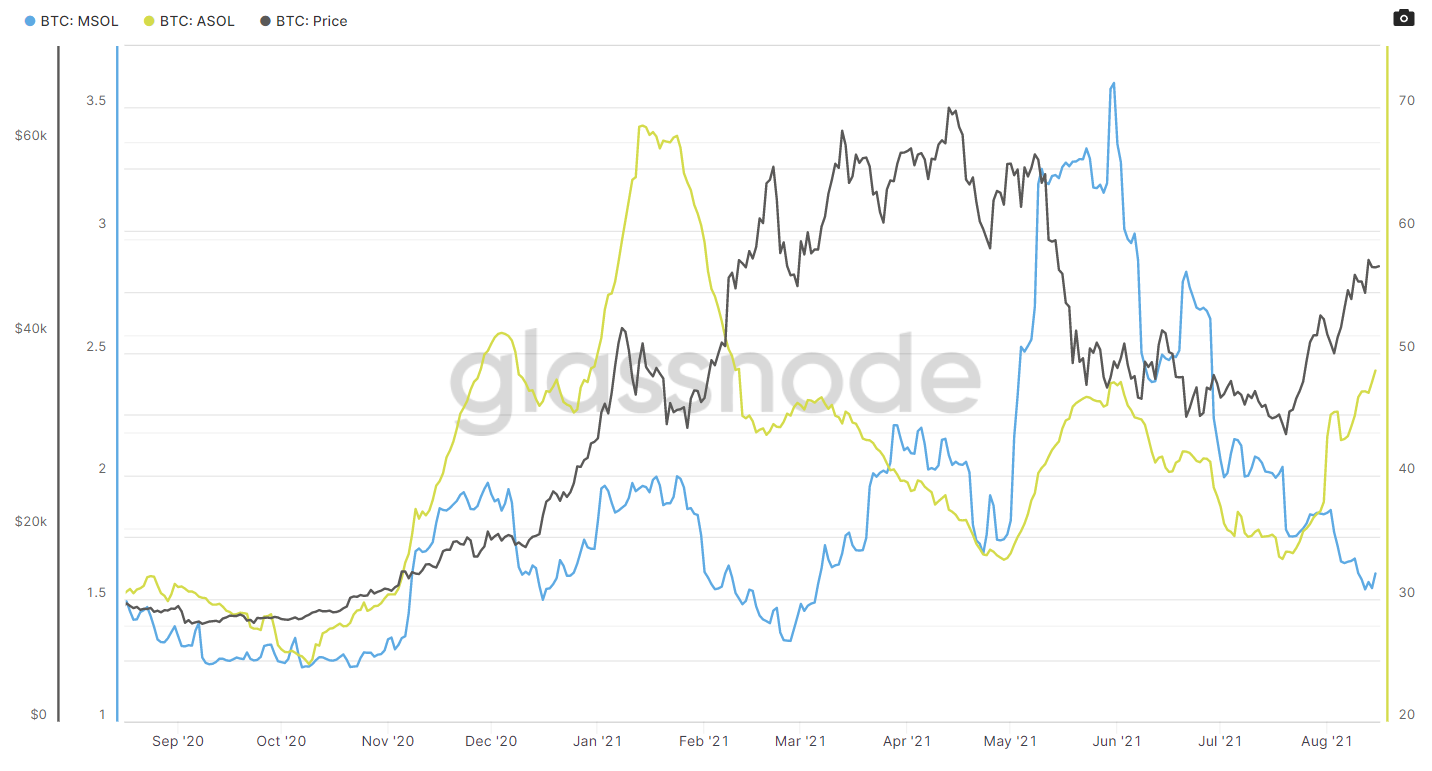
Source: Glassnode
The rise in ASOL highlighted that old coins are currently dominating flow and movement. Historically, for a strong rally, old coin domination has been a good signal but a similar divergence in ASOL and MSOL in the past has been a bearish signal.
However, since the larger trend is currently bullish ASOL value rising in the chart might be suggestive that a sharper bullish trend is still ahead for the asset. The lower MSOL value needed to align a bit with MSOL for the rally to sustain, and its slight uptick at press time came as a sigh of relief.