What’s next after ETC smashes this critical support level

Disclaimer: The information presented does not constitute financial, investment, trading, or other types of advice and is solely the writer’s opinion.
- Bullish defense of $17.66 support finally succumbed to intense selling pressure.
- Bearish bias solidified by shorts advantage in the derivatives market.
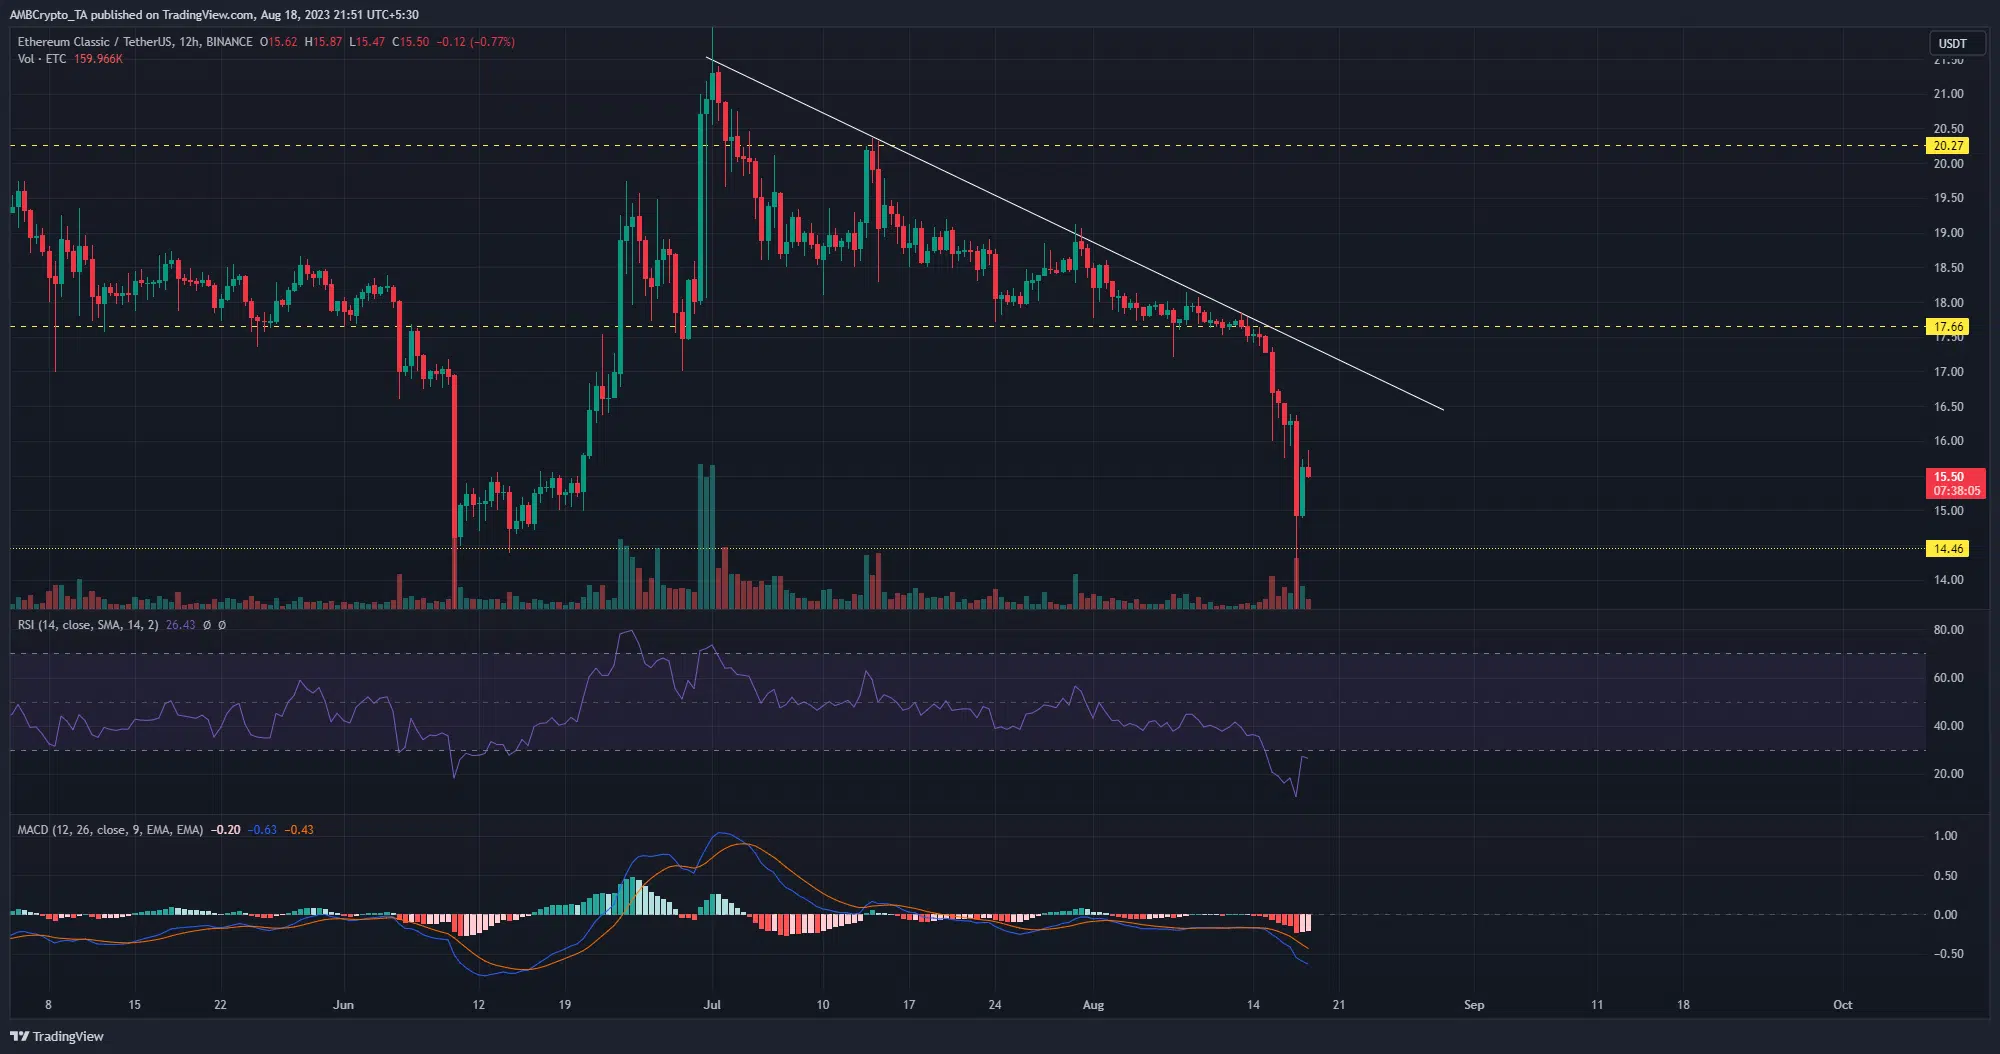
A 17% dip over the past day took Ethereum Classic [ETC] to the June low of $14. This came after the bears successfully cracked the bullish defense of the $17.66 support level.
Realistic or not, here’s ETC market cap in BTC terms
ETC sellers could be on the hunt for more gains with the entire crypto market bleeding out and ETC’s market structure firmly bearish on the higher timeframes.
Buyers crumble under the weight of selling pressure
The $17.66 support level has been a key one for bulls. After the price rejection at the $20.27 resistance level, bulls used the support level to attempt multiple price reversals.
However, the bearish trendline curtailed the bullish rebound attempts. As the price approached the $17.66 support, bulls put up one last defense over a two-week period. Yet, the descent of the bearish trendline below the support level gave ETC bears the necessary ammunition to flip the support level.
A look southward showed that the bearish descent below the $17.66 support level broke the previous bullish lower high. This flipped ETC’s market structure fully bearish on the 12-hour and daily timeframes.
Furthermore, the sellers’ advantage was highlighted by the Moving Average Convergence Divergence (MACD) posting a bearish crossover below the zero mark. Coupled with the red bars, this showed strong selling pressure.
Similarly, the Relative Strength Index (RSI) remained in the oversold zone to underline the lack of buying power.
Sellers press home advantage in the futures market
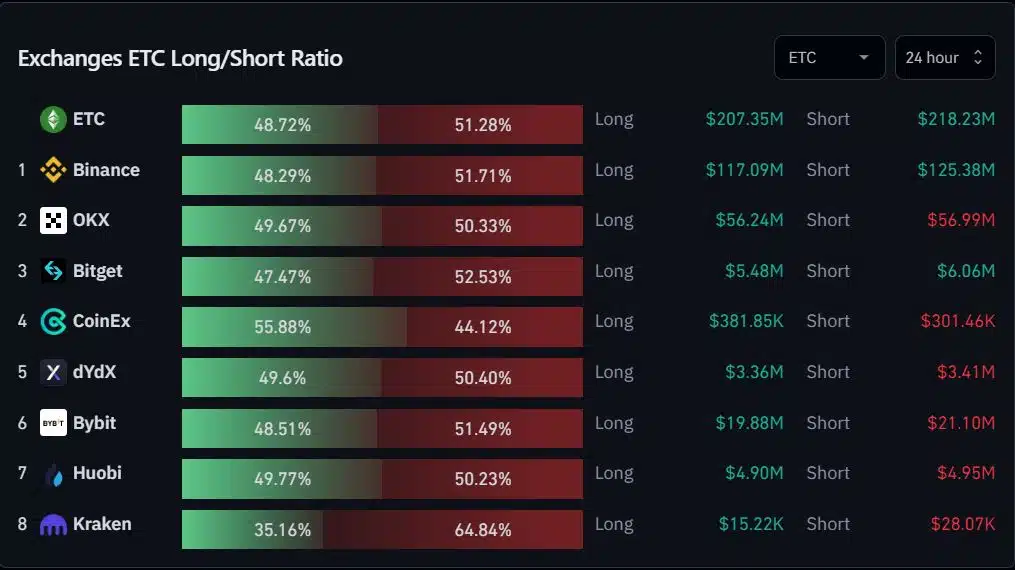
The exchange long/short ratio on the daily timeframe showed market speculators leaned strongly in favor of the bearish momentum. Data from Coinglass showed that shorts controlled 51.28% of open contracts with a $10.88 million difference between buyers and sellers.
How much are 1,10,100 ETCs worth today?
This solidified the long-term bearish bias, as bears look to maximize the selling momentum on Ethereum Classic.


