Why Bitcoin prices could see a minor bounce soon

Disclaimer: The information presented does not constitute financial, investment, trading, or other types of advice and is solely the writer’s opinion.
- The range was not yet breached as BTC bears remained unable to breach the demand zone below $30k.
- The indicators and volume showed that sellers had a strong advantage and further losses can follow.
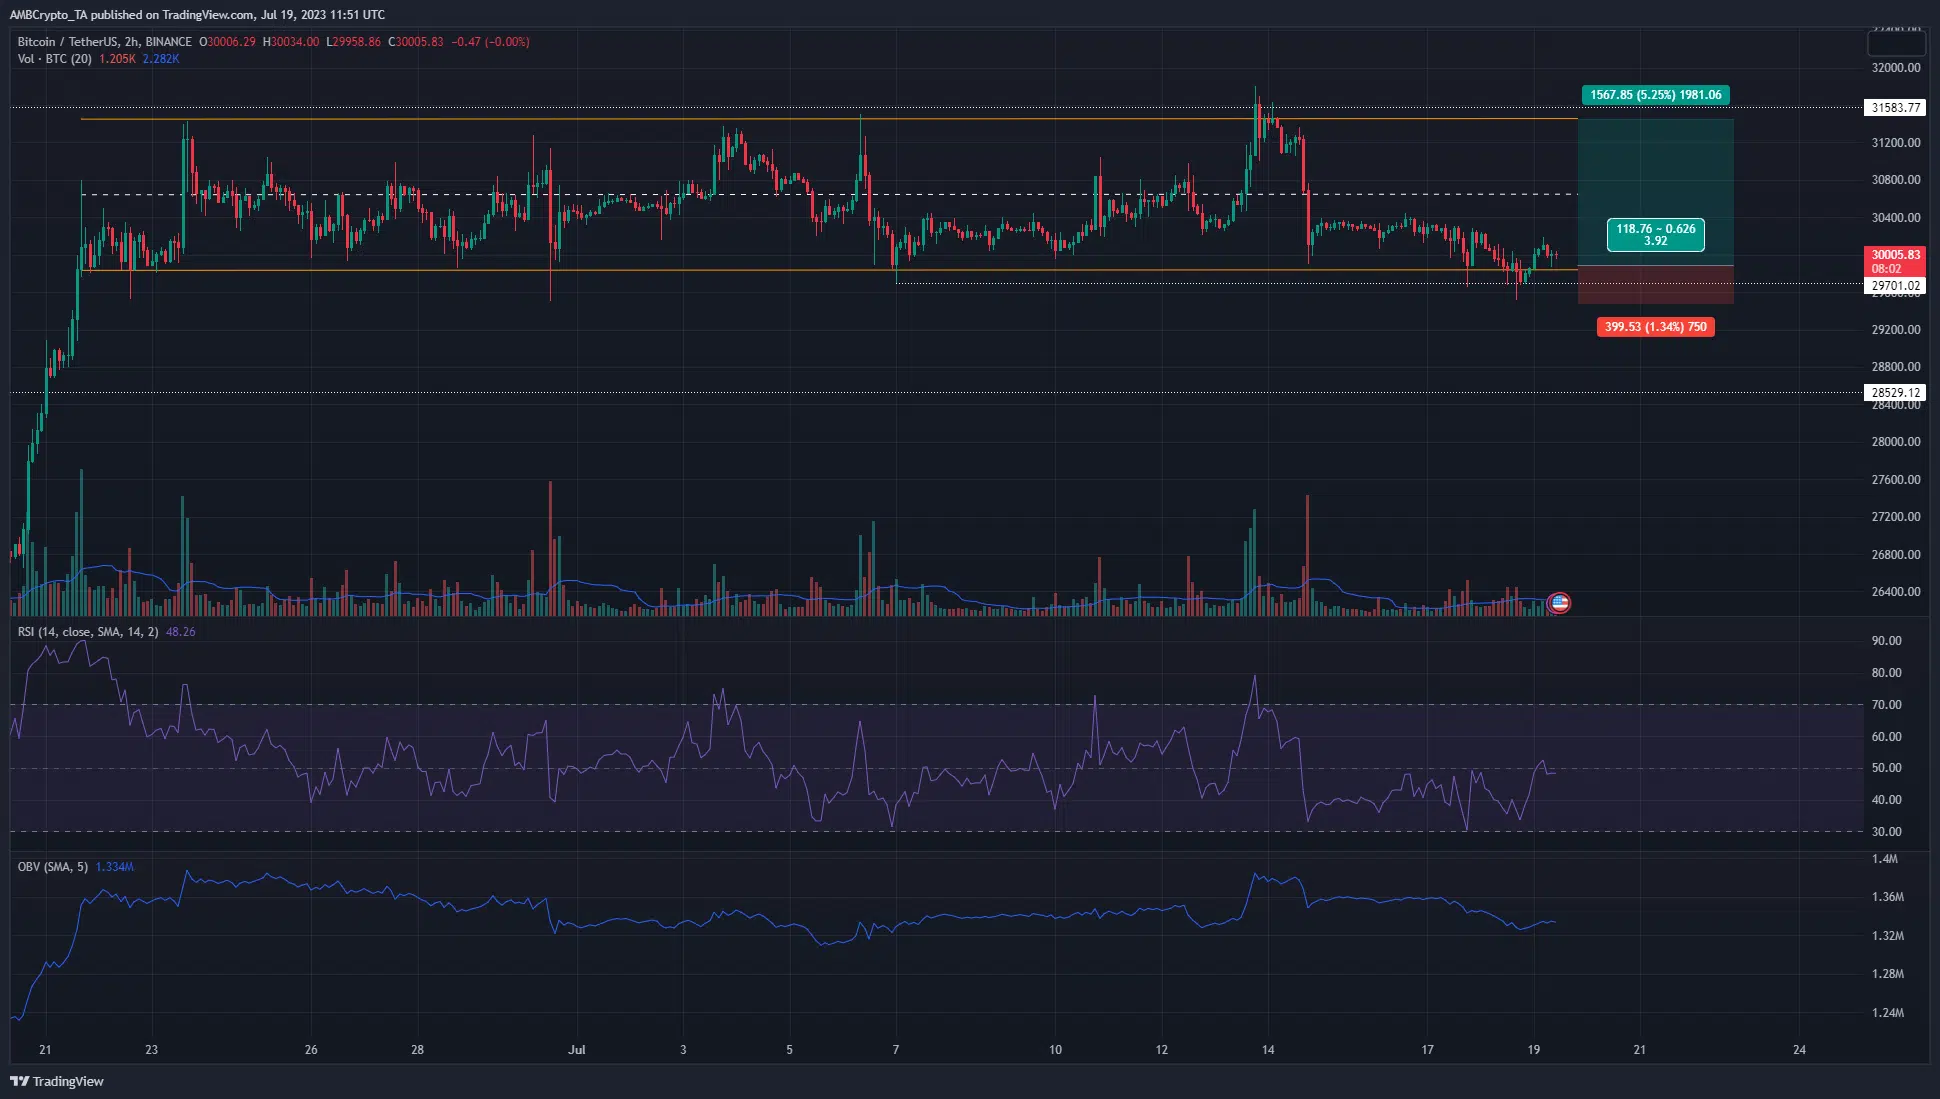
Bitcoin [BTC] continued to trade within the same range it has been stuck inside since 23 June. The sharp rejection at the highs last week saw the price dip back to the lows which the buyers have defended so far.
Read Bitcoin’s [BTC] Price Prediction 2023-24
The range extended from $29.8k to $31.5k on the chart. BTC’s momentum and market structure were bearish on the lower timeframe chart, but contrarian traders could be rewarded if the bulls can reverse the recent losses.
The range remained undefeated which meant Bitcoin traders can expect a continuation
In a report last week, it was highlighted that a drop below the $30k mark could offer a buying opportunity. On 18 July BTC did see a drop to the $29.5k level, which was the low that the price reached on 30 June as well.
At the time of writing, the RSI was below neutral 50 but formed a hidden bearish divergence. This is when the price forms a lower high but the RSI forms a higher high, and it signals a continuation of a downtrend. The OBV also supported this idea as it has sunk lower over the past three days to show bearish dominance.
Yet, the indicators follow price action, and the price showed that there is a good amount of demand beneath the $30k mark. Hence, buyers can look to hold BTC over the next few days. Their take profit levels are the mid-range mark at $30.6k and the range highs at $31.5k.
Is your portfolio green? Check the Bitcoin Profit Calculator
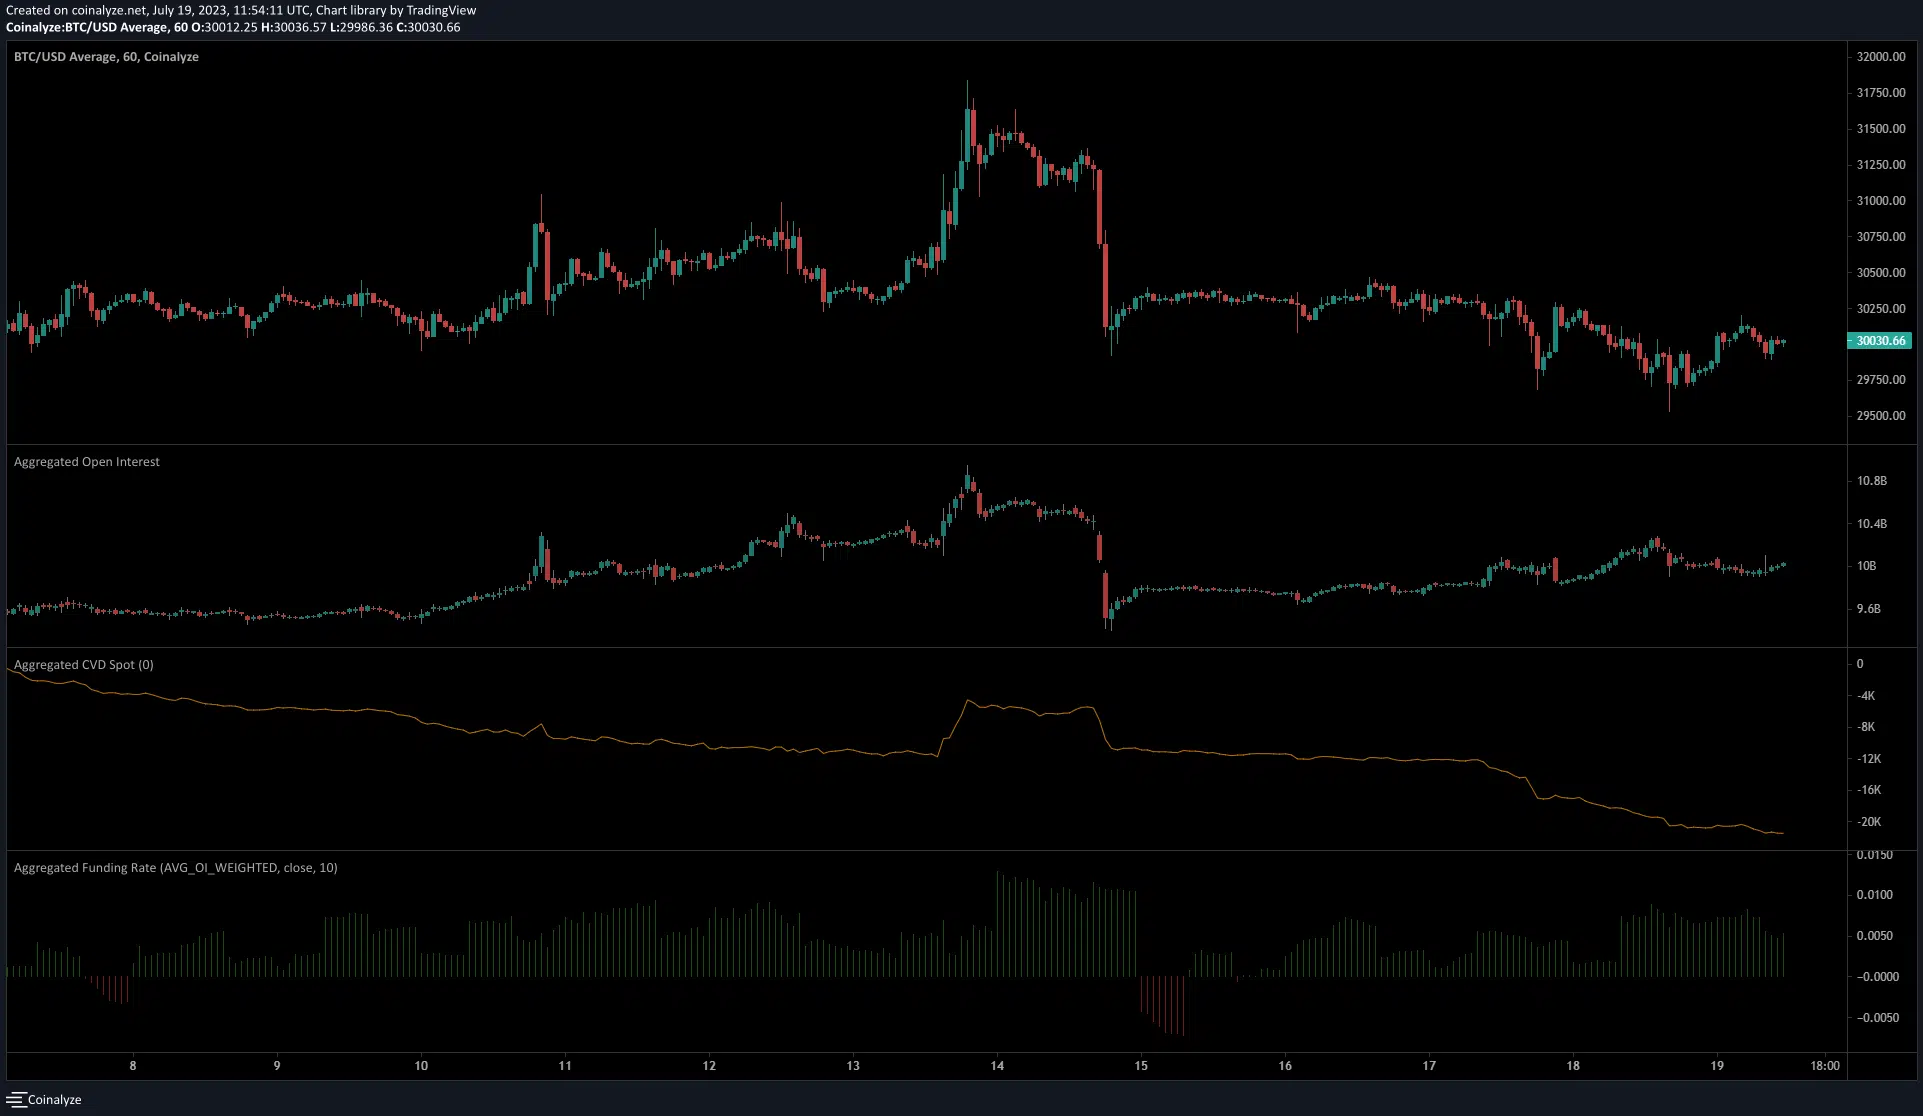
The short-term bearish sentiment was highlighted in the Open Interest chart

Source: Coinalyze
On 18 July, Bitcoin prices declined from $30.2k to $29.7k. During this time the Open Interest climbed $9.78 billion to $10.24 billion. This was a sign of strong bearish sentiment in the market on the lower timeframes.
Moreover the spot CVD continued to trend downward to show selling pressure remained strong. The funding rate was positive but offered little solace to the bulls. Although evidence pointed toward further losses, the range formation must be respected until it is broken.


