Why Bitcoin’s [BTC] move in this direction seemed likely after this breakdown

Disclaimer: The findings of the following analysis are the sole opinions of the writer and should not be considered investment advice.
- Bitcoin fell below its vital support range after revealing a strong bearish inclination.
- The crypto’s development activity and MVRV ratio chalked out a steep downtrend.
Bitcoin’s [BTC] previous bounce-backs from its vital support range (rectangle, cyan) kept up the near-term recovery hopes alive. But its recent plunge below the daily 20 EMA (red) and 50 EMA (cyan) have reaffirmed a robust selling edge.
Read Bitcoin’s Price Prediction 2023-24
The price action entered into a relatively low liquidity region as it broke into high volatility after the recent pullback. At press time, BTC was trading at $16,818.49, down by 3.65% in the last 24 hours.
BTC hovered near a vital trendline
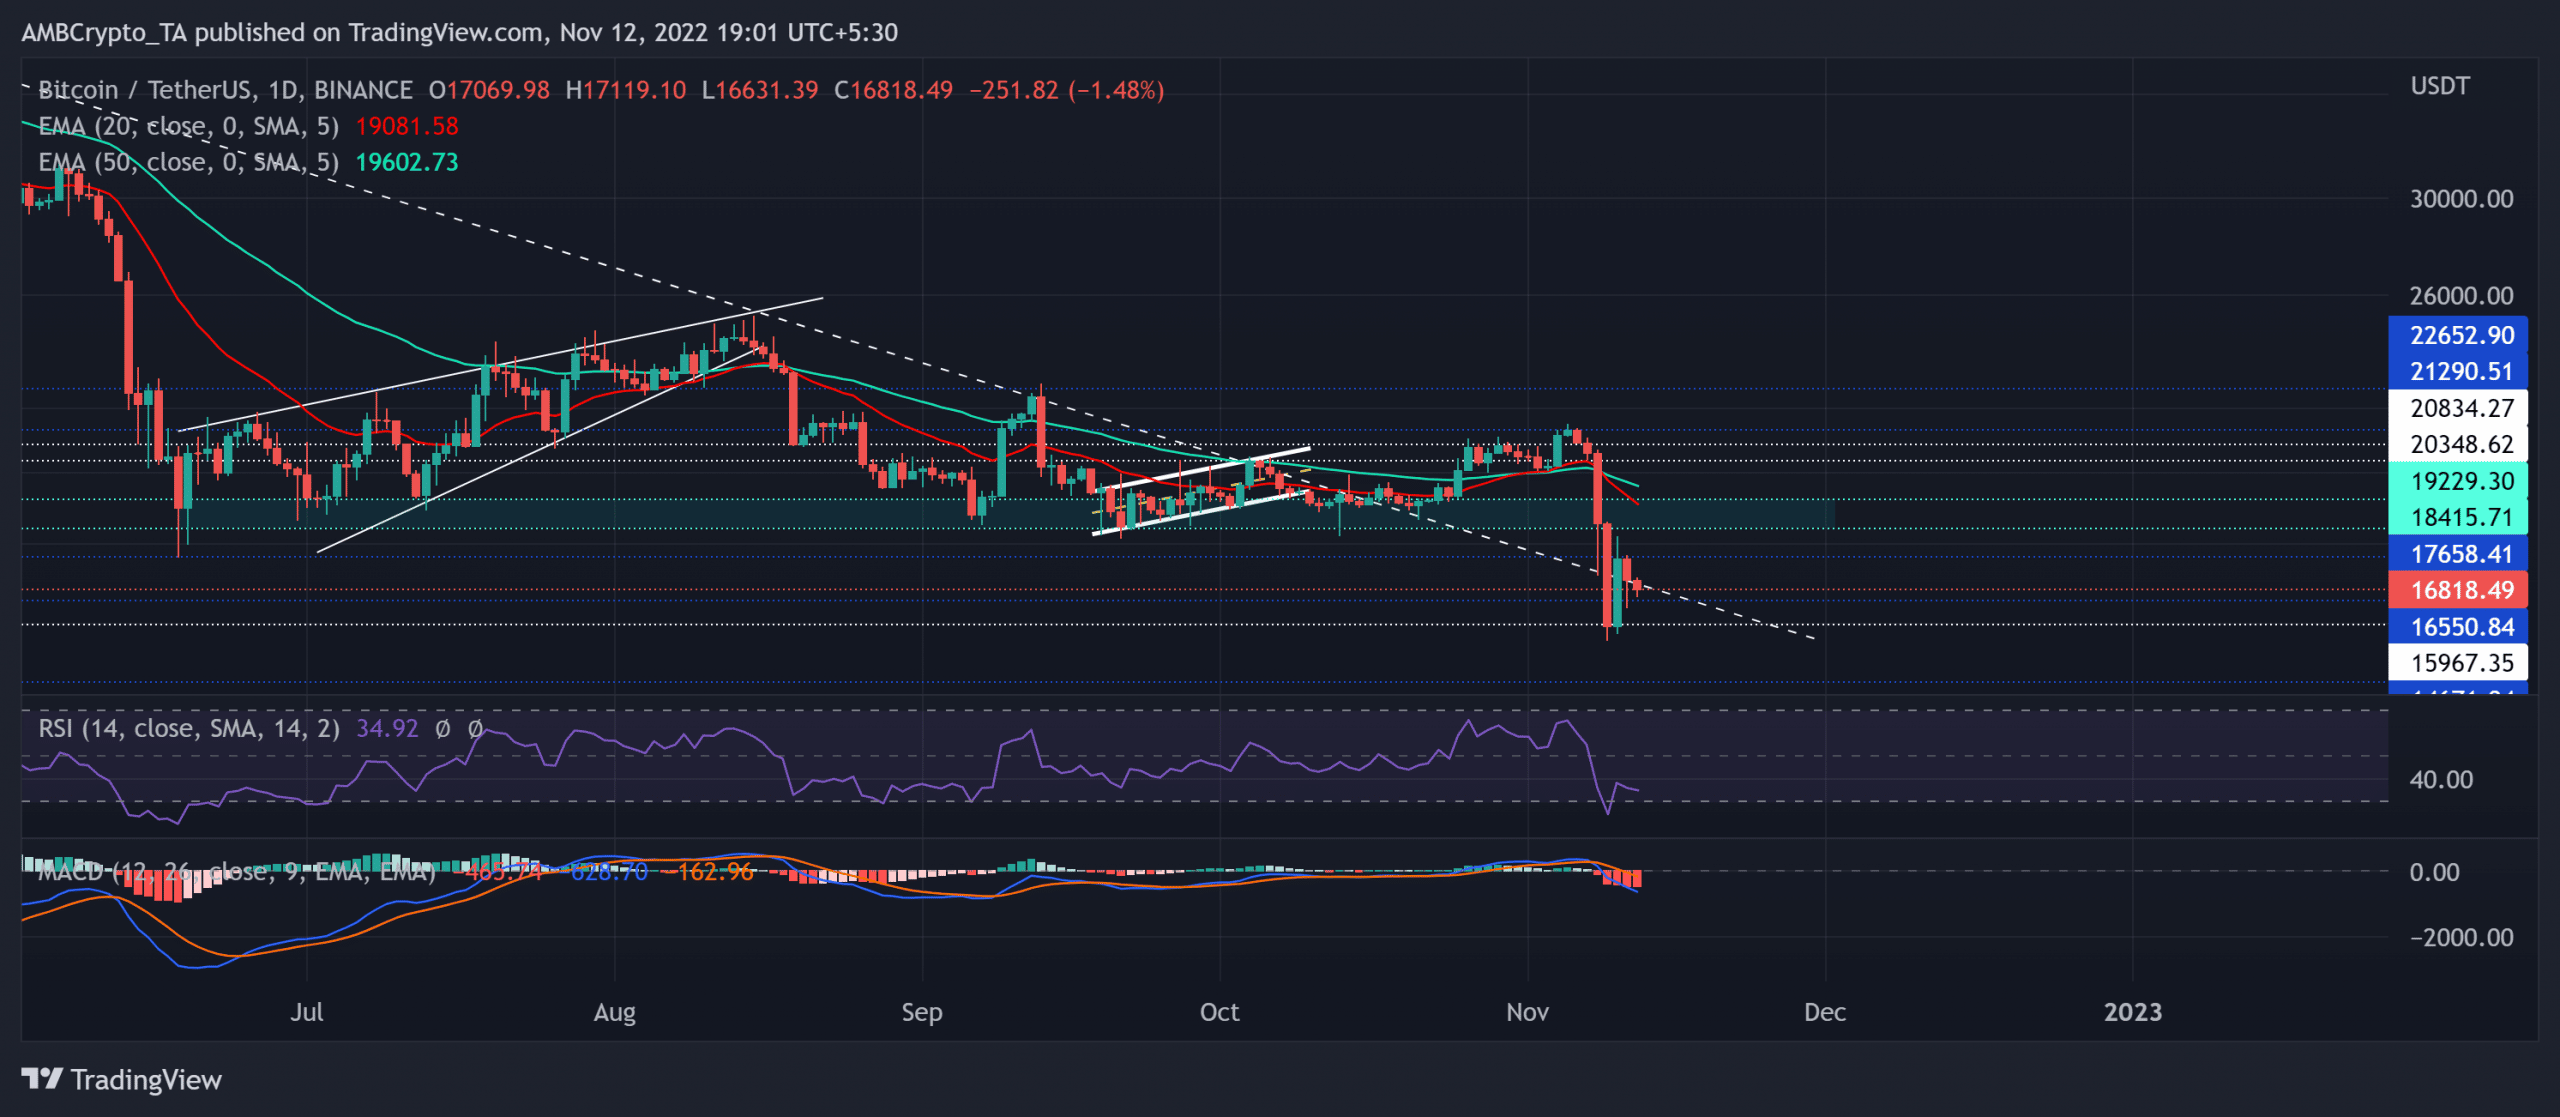
At the time of writing, the king coin marked a reliable rebound from the $15.9K support. Consequently, the bulls strived to challenge the limitations of the $17.6K ceiling.
The trendline resistance (white, dashed) could play a crucial role in influencing the coin’s trajectory. Should the bulls inflict a close above this level, BTC could stop the bears from retesting fresher lows.
In such circumstances, the first major resistance level would lie in the $17.6k zone. The crypto entered a high volatility phase immediately after taking a U-turn from the $21.2K resistance. A sustained position below the trendline resistance could induce a pulldown toward the $15.9K support.
The bearish cross on the 20/50 EMA further improved the chances of bears maintaining their immediate advantage in the market.
The Relative Strength Index (RSI) kept plunging while depicting a bearish market. Similarly, the Moving Average Convergence Divergence (MACD) line and the Signal line fell below the zero mark to reveal an increasing bearish edge over the past few sessions.
A decline in the MVRV ratio and development activity
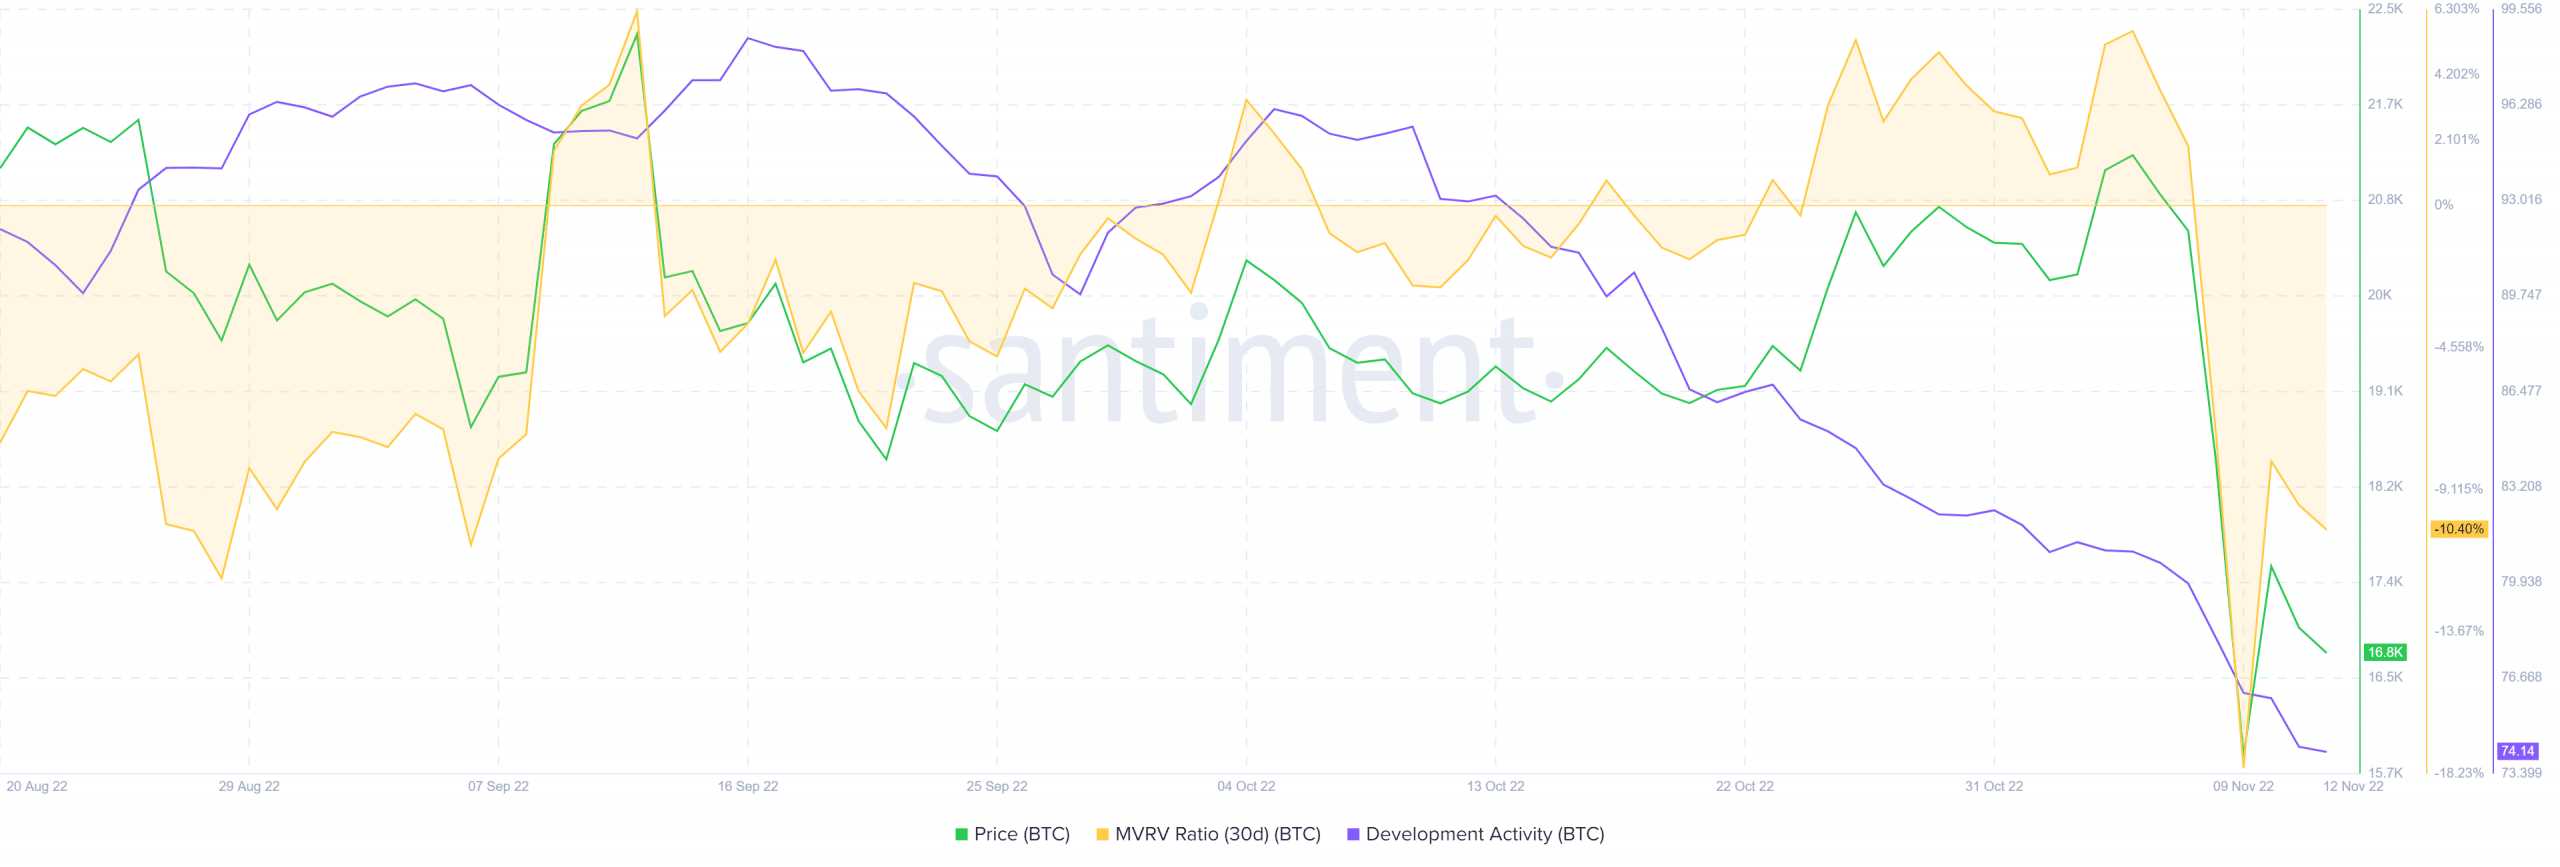
Post its relatively high levels of development activity in October, the metric marked a steep downtrend over the last month.
To top it up, the king coin’s 30-day MVRV ratio declined well below the zero mark to depict an edge for the sellers. The last time this ratio fell to such lows was in May 2021.
Nonetheless, the targets would remain the same as discussed. Also, investors/traders should factor in macro-economical factors affecting the broader sentiment. This analysis will help them increase the chances of a profitable bet.