Why Bitcoin’s H2 2026 could be defined by months of sideways price action
Bitcoin is in an accumulation zone, which could see months of sideways or lower price action before recovery.

Bitcoin [BTC] is likely to experience a bearish second half of the year 2026. It was already battling at the $60k psychological level. There was reason to believe that the 3.1% price bounce of the past 24 hours was driven more by deleveraging than by aggressive spot buying.
Crypto analyst Axel Adler Jr. explained this idea in a post on X. The idea aligned with the broader onchain metrics, which suggested we have not reached conditions that mirror historical cycle bottoms but are just on the way there.
The “post-halving cooling phase” scenario was one AMBCrypto reported on recently. Liquidity is one of the key factors to any Bitcoin recovery, but the entire second half of the year could be a significant challenge.
Short-term gains might dissolve soon, and liquidity conditions will be the primary driver of cross-asset performance through H2 2026, according to Ryan Lee, Chief Analyst at Bitget Research.
Markets will be watching Treasury yields, Federal Reserve policy, inflation, and ETF flows for signs of changing risk appetite. For digital assets, renewed institutional inflows and improving liquidity conditions could provide support, while elevated yields and persistent ETF outflows remain the key risks to monitor.
Bitcoin macro accumulation trends and sideways price action expectations
In a report last week, AMBCrypto examined the Bitcoin trends of the supply in profit. Founder and CEO of Alphractal, Joao Wedson, explained that the launch of the spot ETFs has changed short-term holder behavior.
As a result, it drove a breakdown below the multi-year rising trendline on the supply in profit metric.
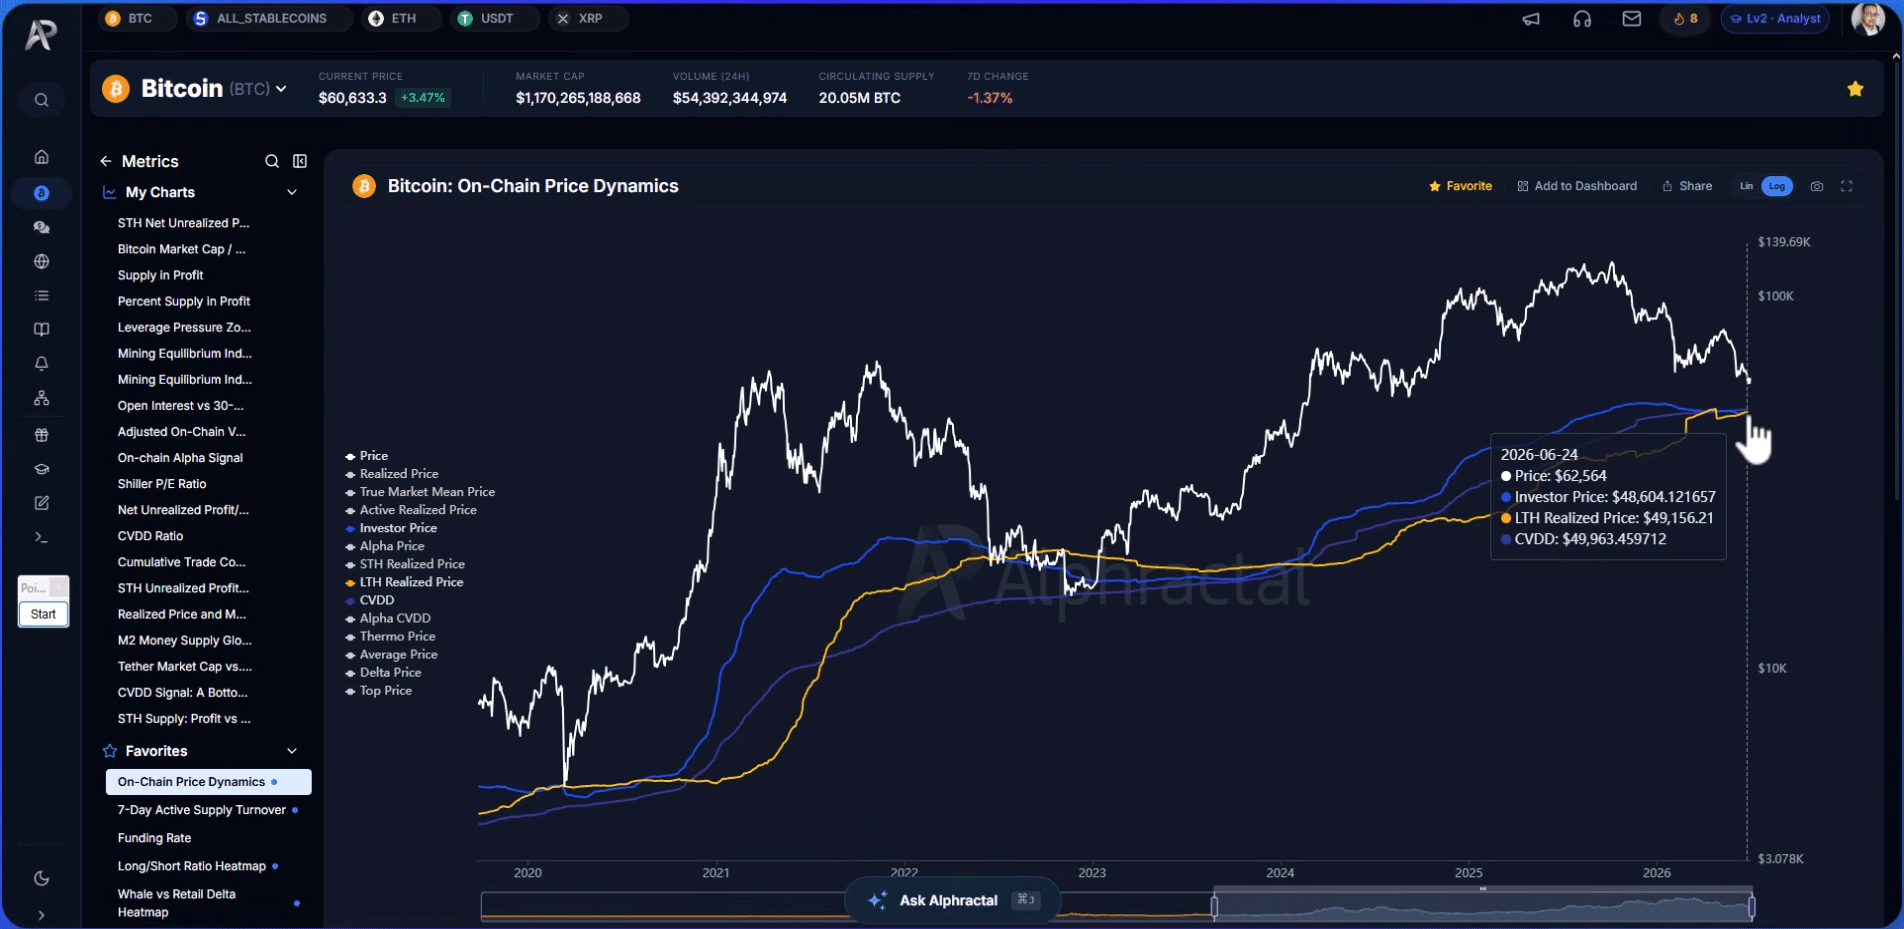
The analyst also used a set of basic onchain metrics, including short and long-term holder realized price and the cumulative value days destroyed [CVDD]. The latter, in particular, has tended to mark major cyclical bottoms.
The LTH realized price was $49,156, and the CVDD was $49,963. These levels represented the bearish price targets for H2 2026.
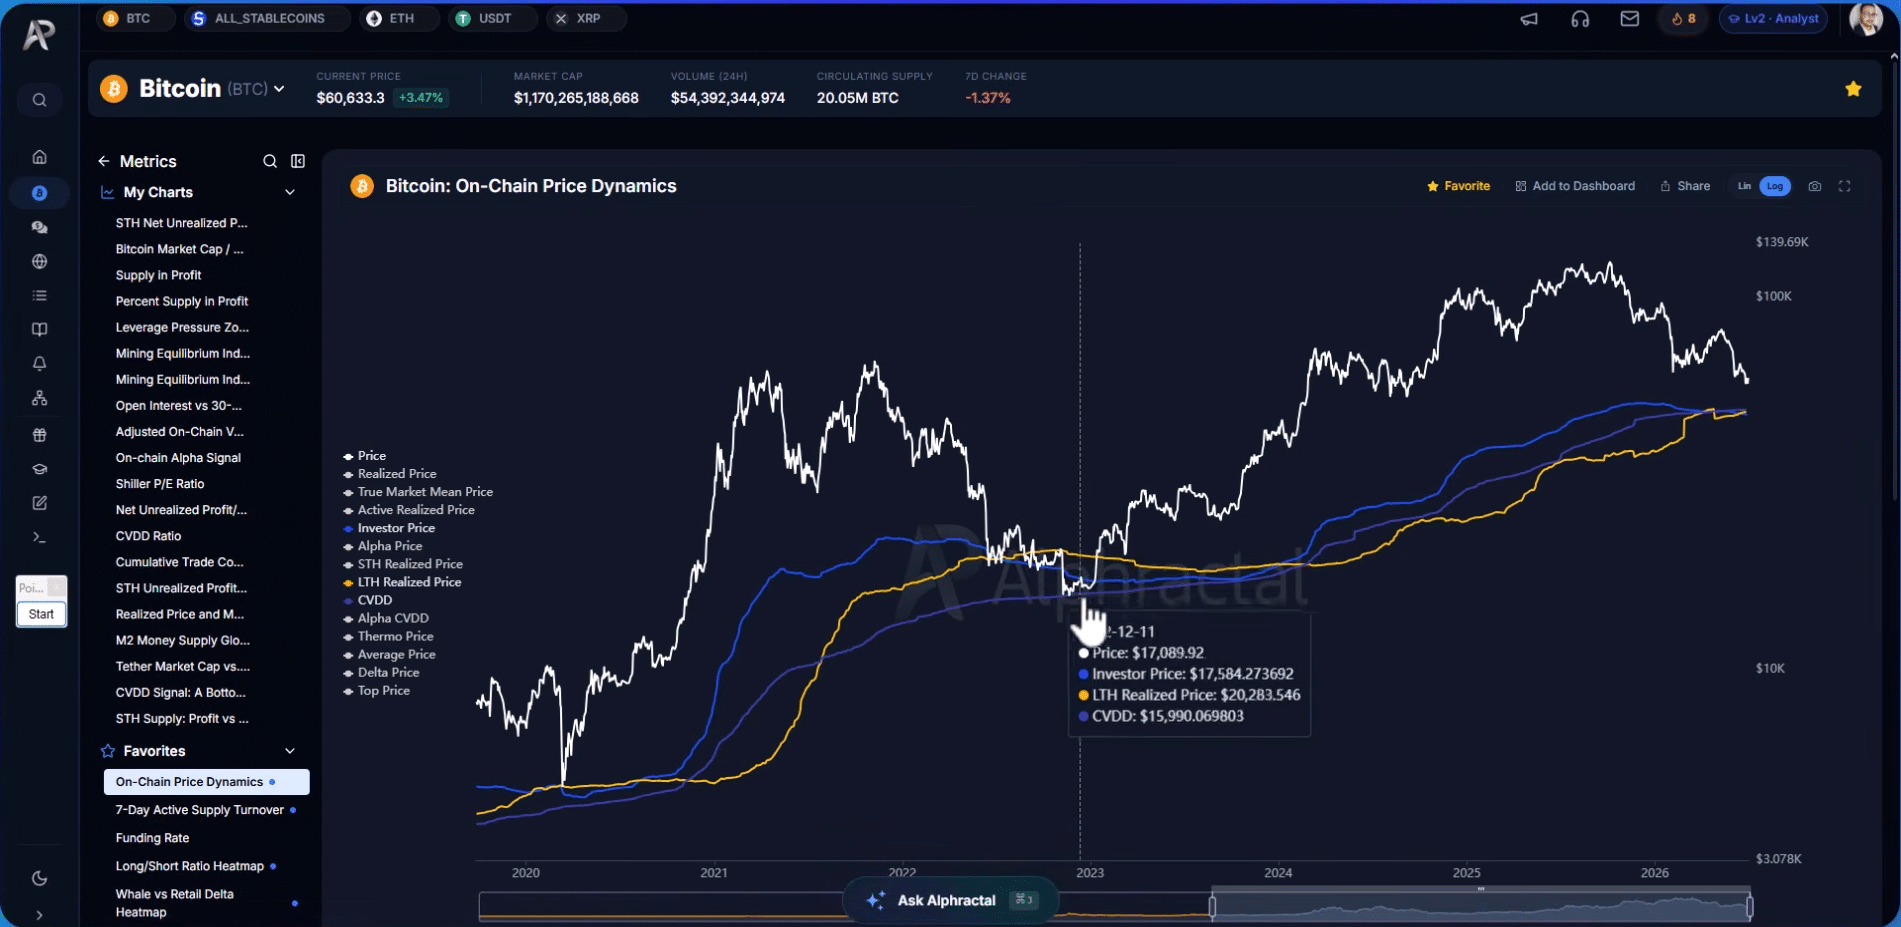
The analyst drew parallels to the 2022 market bottom. In November 2022, the price of Bitcoin tested the CVDD line just under $16k, before beginning a longer-term recovery.
These metrics are reactive to the movement of older BTC, the analyst said. The leading crypto is in an accumulation zone, which could see months of sideways or lower price action before recovery.
Final Summary
- The second half of 2026 could be difficult for Bitcoin holders and traders.
- The onchain price dynamics showed parallels to 2022, suggesting that a price drop toward the $49k level later in 2026 is possible.