Why Bitcoin’s price outlook remains bearish despite $63K prediction

- Bitcoin has a bearish trajectory in the short-term.
- Liquidity pools could pull the price to $63k in the coming days.
Bitcoin [BTC] miners saw a large drop in their profit margins when the price fell to $49k two weeks ago. This led to miner capitulation and increased outflows from miners.
The spike in hash rate and mining difficulty put the smaller miners in a tough spot.
The technical analysis and the liquidation heatmap gave clues that a BTC recovery would face a massive hurdle above the $60k psychological resistance. Do the bulls have enough ammunition to break this barrier?
The momentum might be shifting towards the bulls
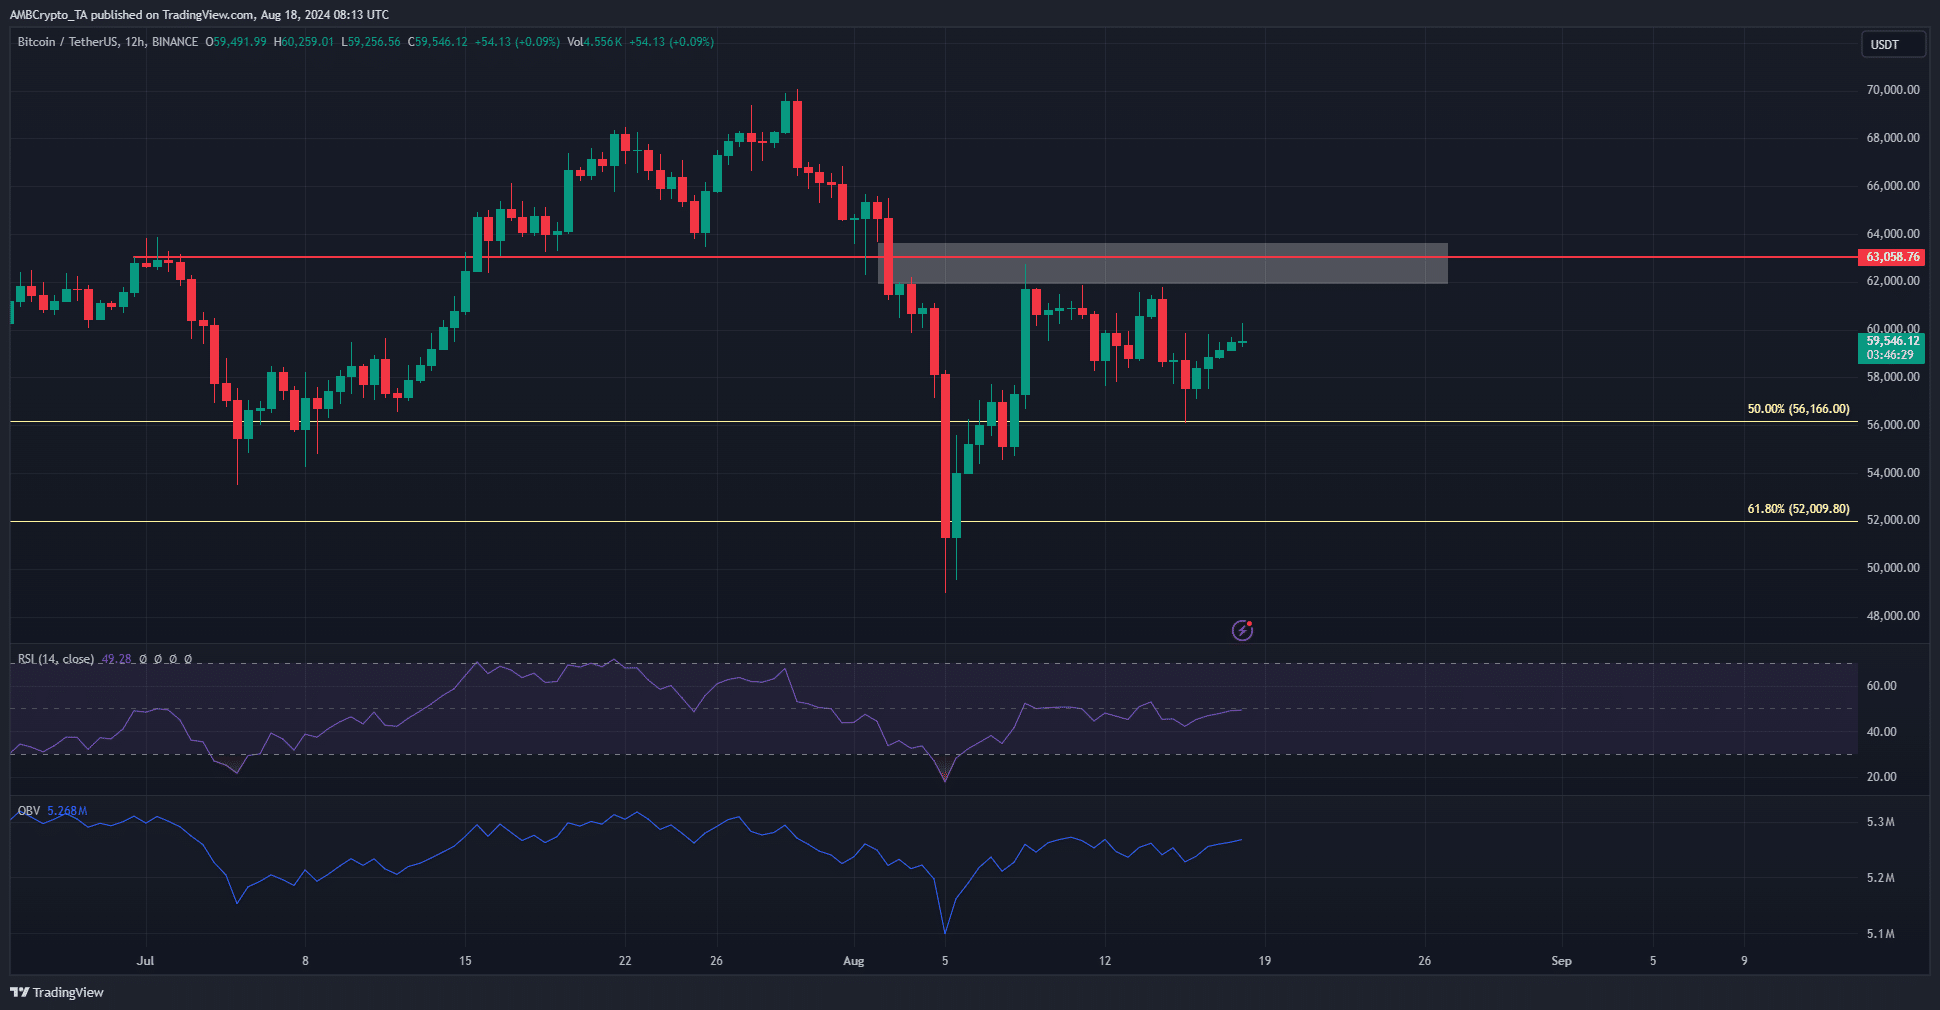
The RSI on the 12-hour chart has skirted about the neutral 50 level over the past week. The $61.5k region has consistently rebuffed the price during this period.
At press time, the RSI appeared to be trying to move above 50 once more.
The OBV has also climbed higher over the past two days. This indicated that demand might be enough to drive BTC to the $63k mark. However, an imbalance and a resistance level coincided there.
Bitcoin bulls will have a tough time battling the sellers, but they have one factor that could help.
Magnetic zones favor the BTC bulls in the short-term

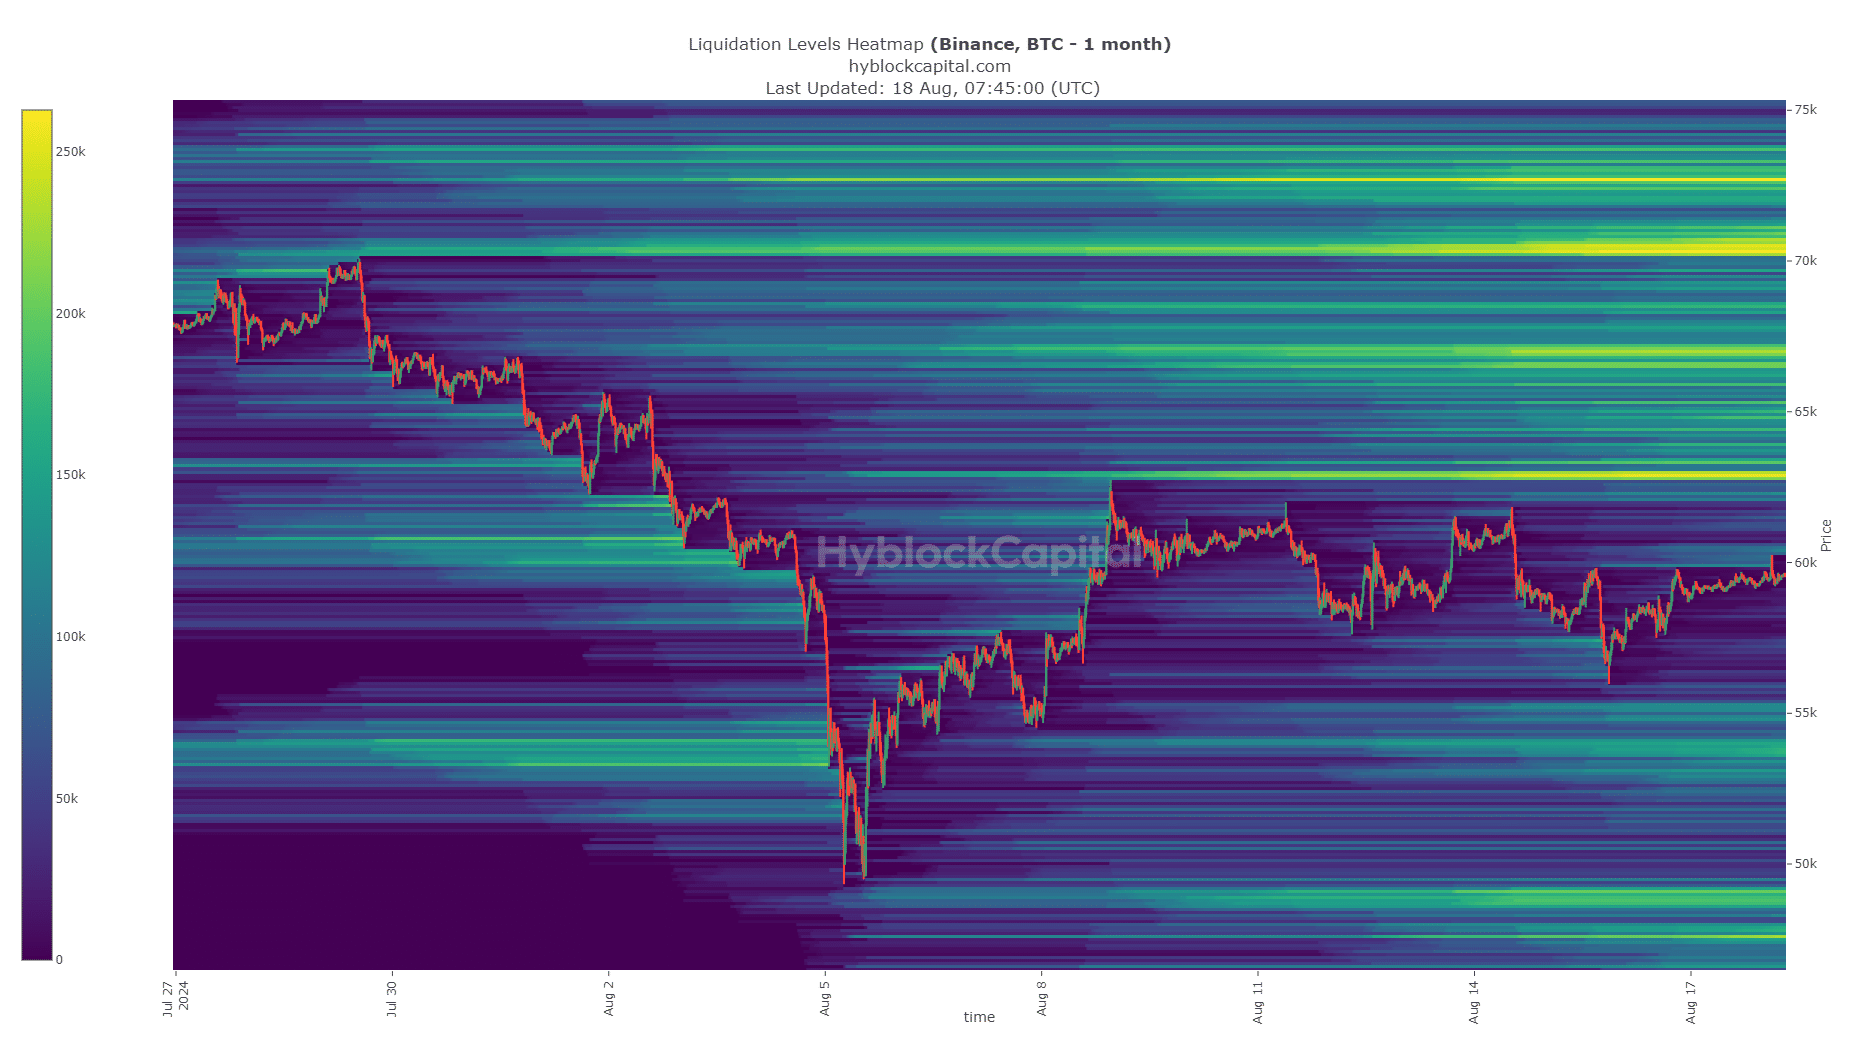
Source: Hyblock
The liquidation heatmap showed a high concentration of liquidation levels at $63k and $67.1k.
The proximity and density of the liquidity cluster at $63k could see Bitcoin jump higher to sweep the region before a pullback.
Read Bitcoin’s [BTC] Price Prediction 2024-25
The liquidity above $65k was also a magnetic zone, and a move to $67.1k can not be discounted.
However, traders must remember that BTC has a bearish market structure on the weekly chart and needs a move past $69.5k to change this situation.
Disclaimer: The information presented does not constitute financial, investment, trading, or other types of advice and is solely the writer’s opinion


