Why Chainlink price faces a make-or-break test at the $8.88 level
Chainlink has seen a deep retracement of the August- September rally. When can the bulls revive the uptrend?



In the recent selloff, Chainlink [LINK] token prices fell to a low of $8.57 on Saturday, the 14th of November. The downtrend from October to the first week of November accelerated over the past ten days.
Driven by fear prevailing across the crypto markets, led by heavy Bitcoin [BTC] and Ethereum [ETH] losses, LINK fell below the long-term swing support of $10.61.
Intensified selling accompanied by LINK exchange withdrawals
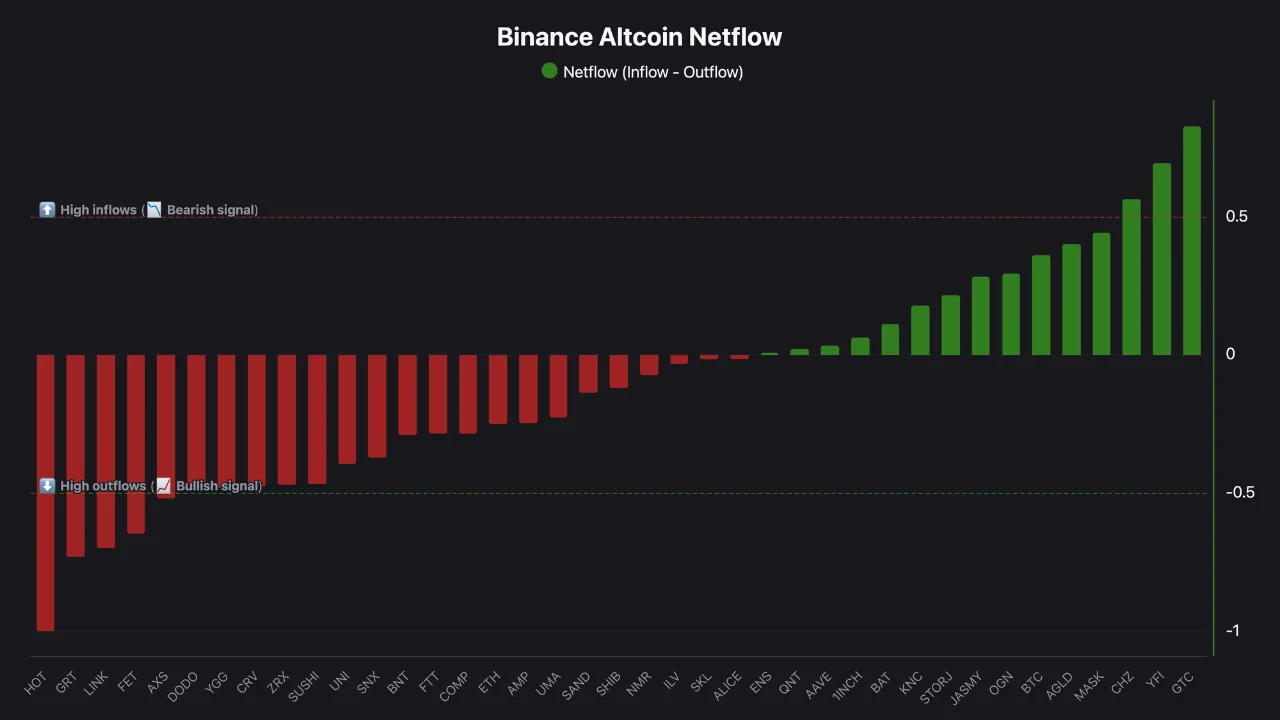
Crypto analyst FundingVest observed that certain altcoins saw sizeable outflows from Binance. Chainlink was one of them. By comparison, Bitcoin saw moderate inflows while Ethereum showed slight outflows.
Shrinking supply on exchanges was a bullish signal for the altcoin, even though it ceded the $10.61 swing level to the bears. However, it is not a guarantee of a price rally by itself.
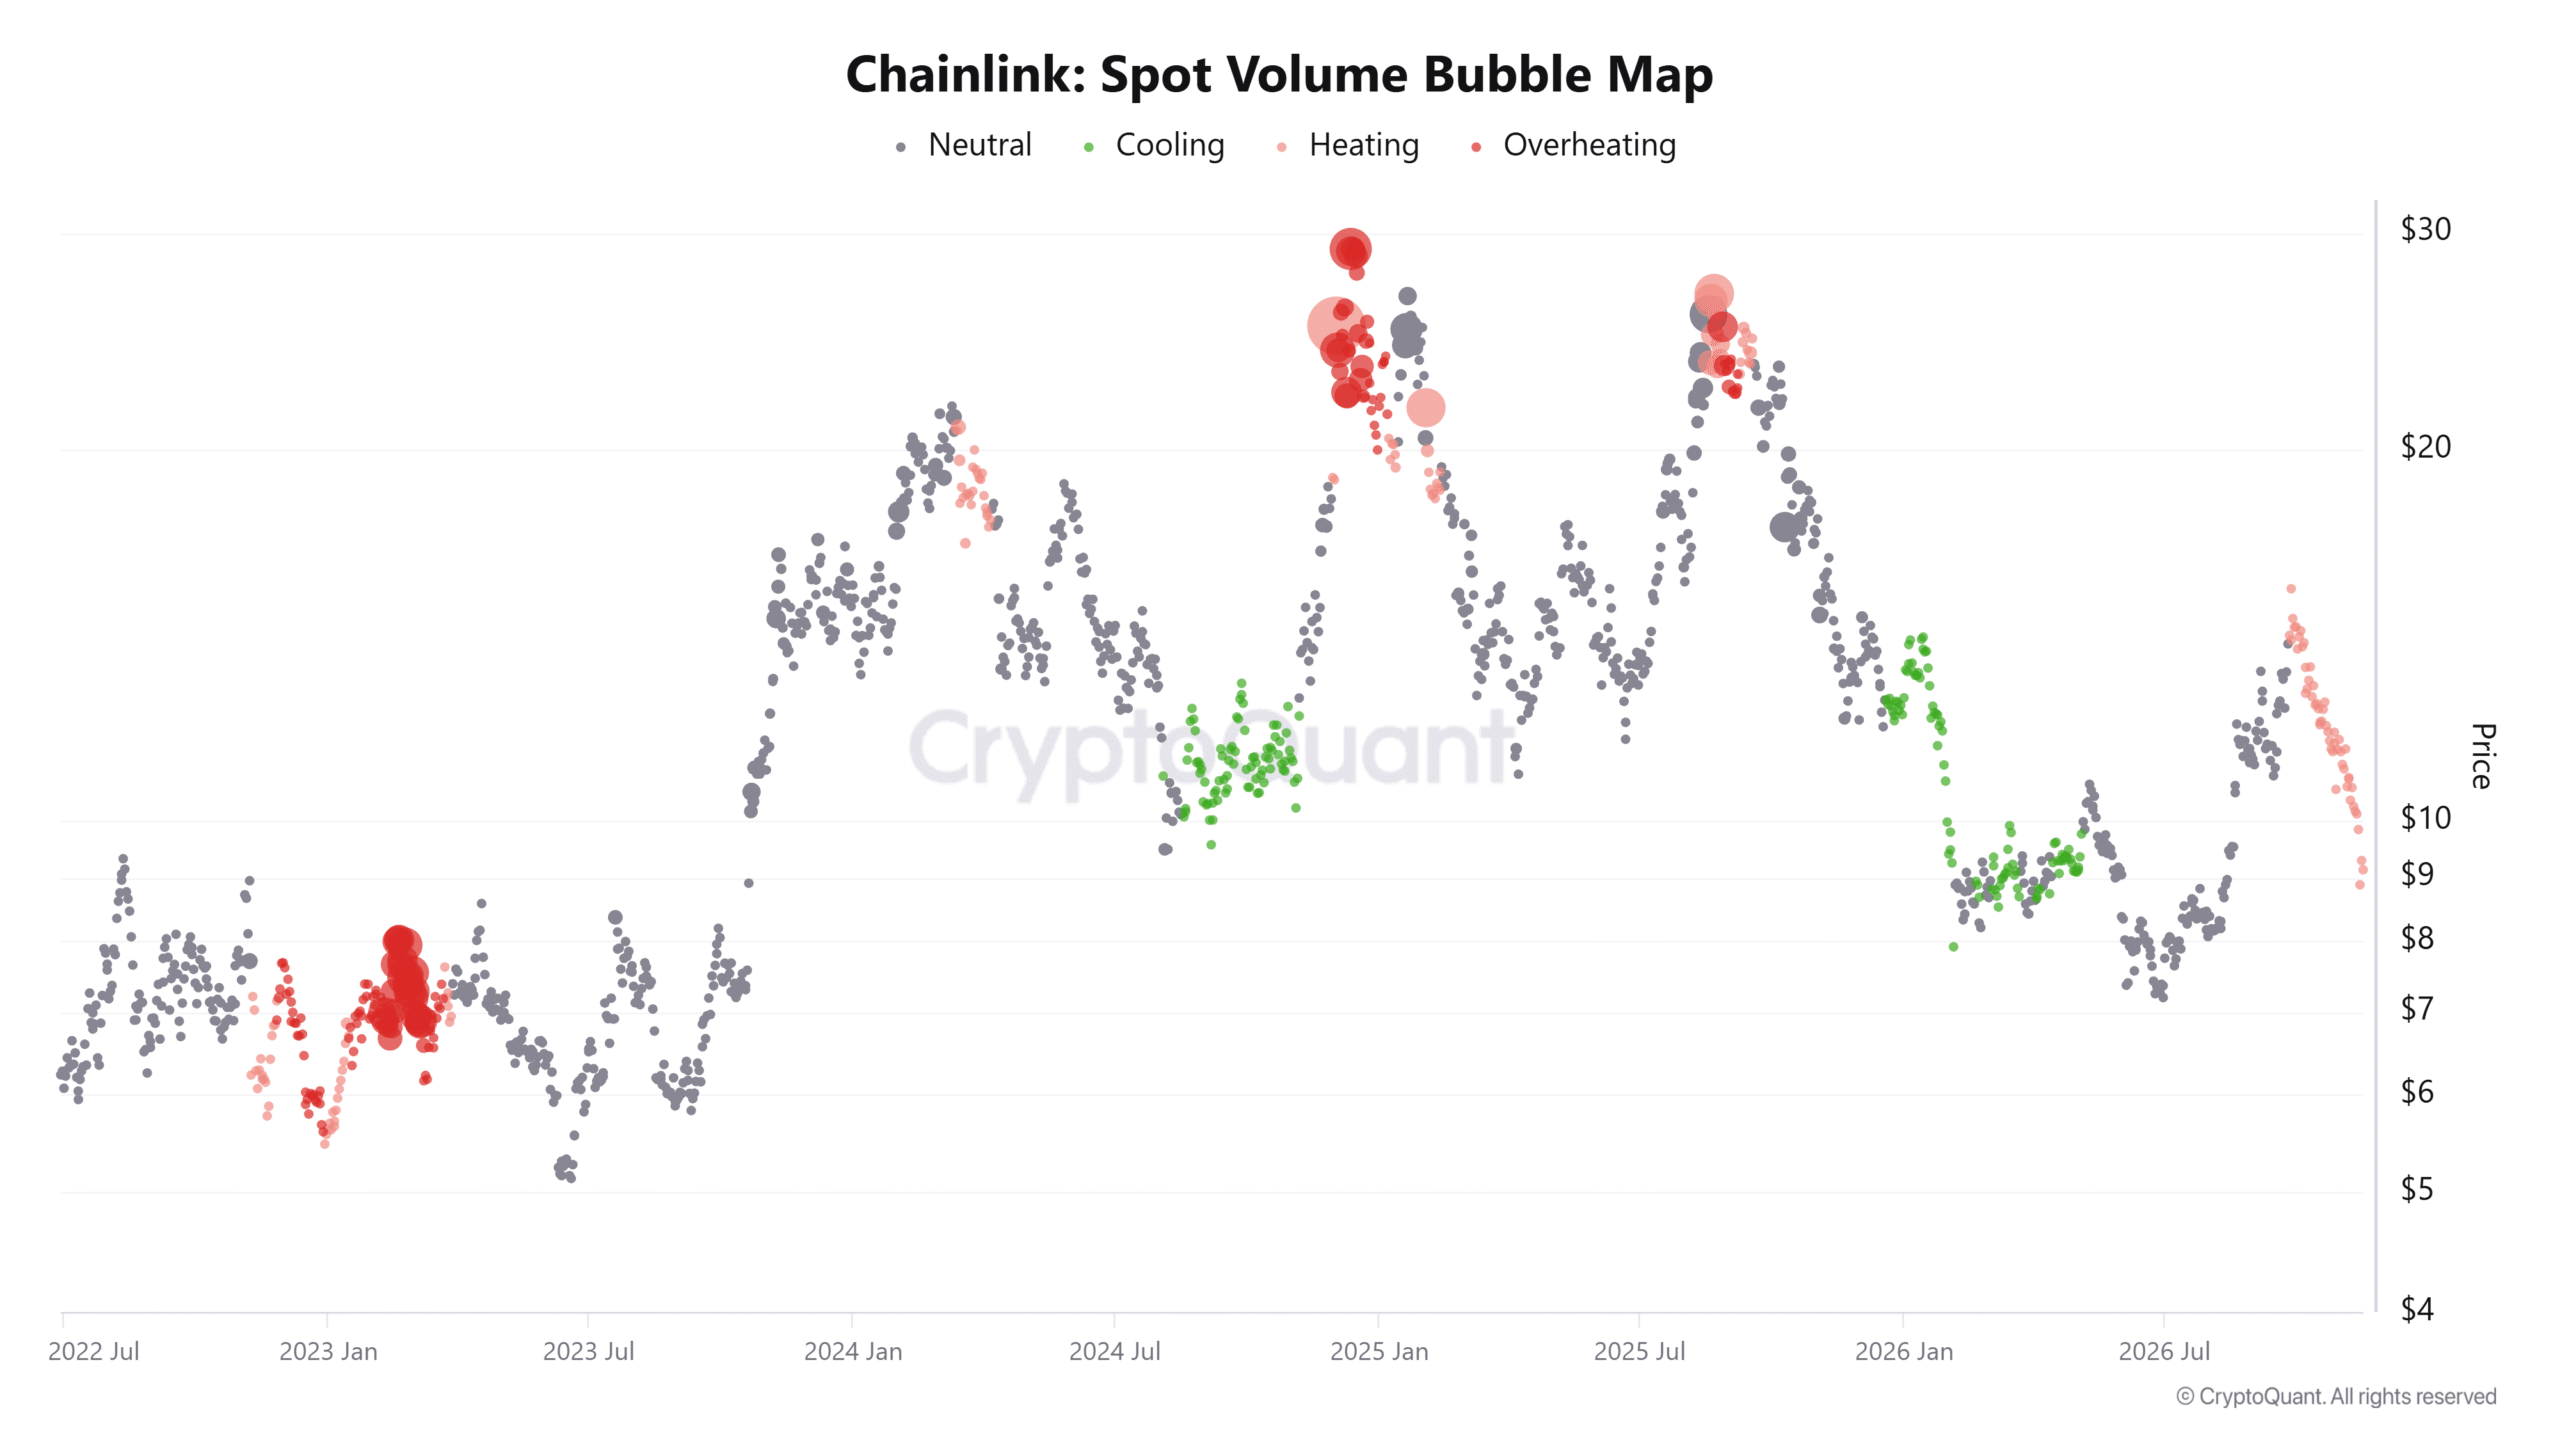
The exchange outflows are overshadowed by the persistent heating signal on the spot volume bubble map. Red bubbles signal increased trading activity in LINK markets.
Heating volume signals alongside a steady price correction from $14.3 to $10.6, a 25.7% decline in just over a month, was a sign of sustained selling.
Such pressure on LINK might be difficult to shrug off, especially now that the price structure was also bearish.
Will the Chainlink price prediction come true?
Earlier this month, AMBCrypto had drawn attention to the $10.61-$10.87 area. Key swing levels here marked it as a demand zone, one that bulls managed to defend in late October.
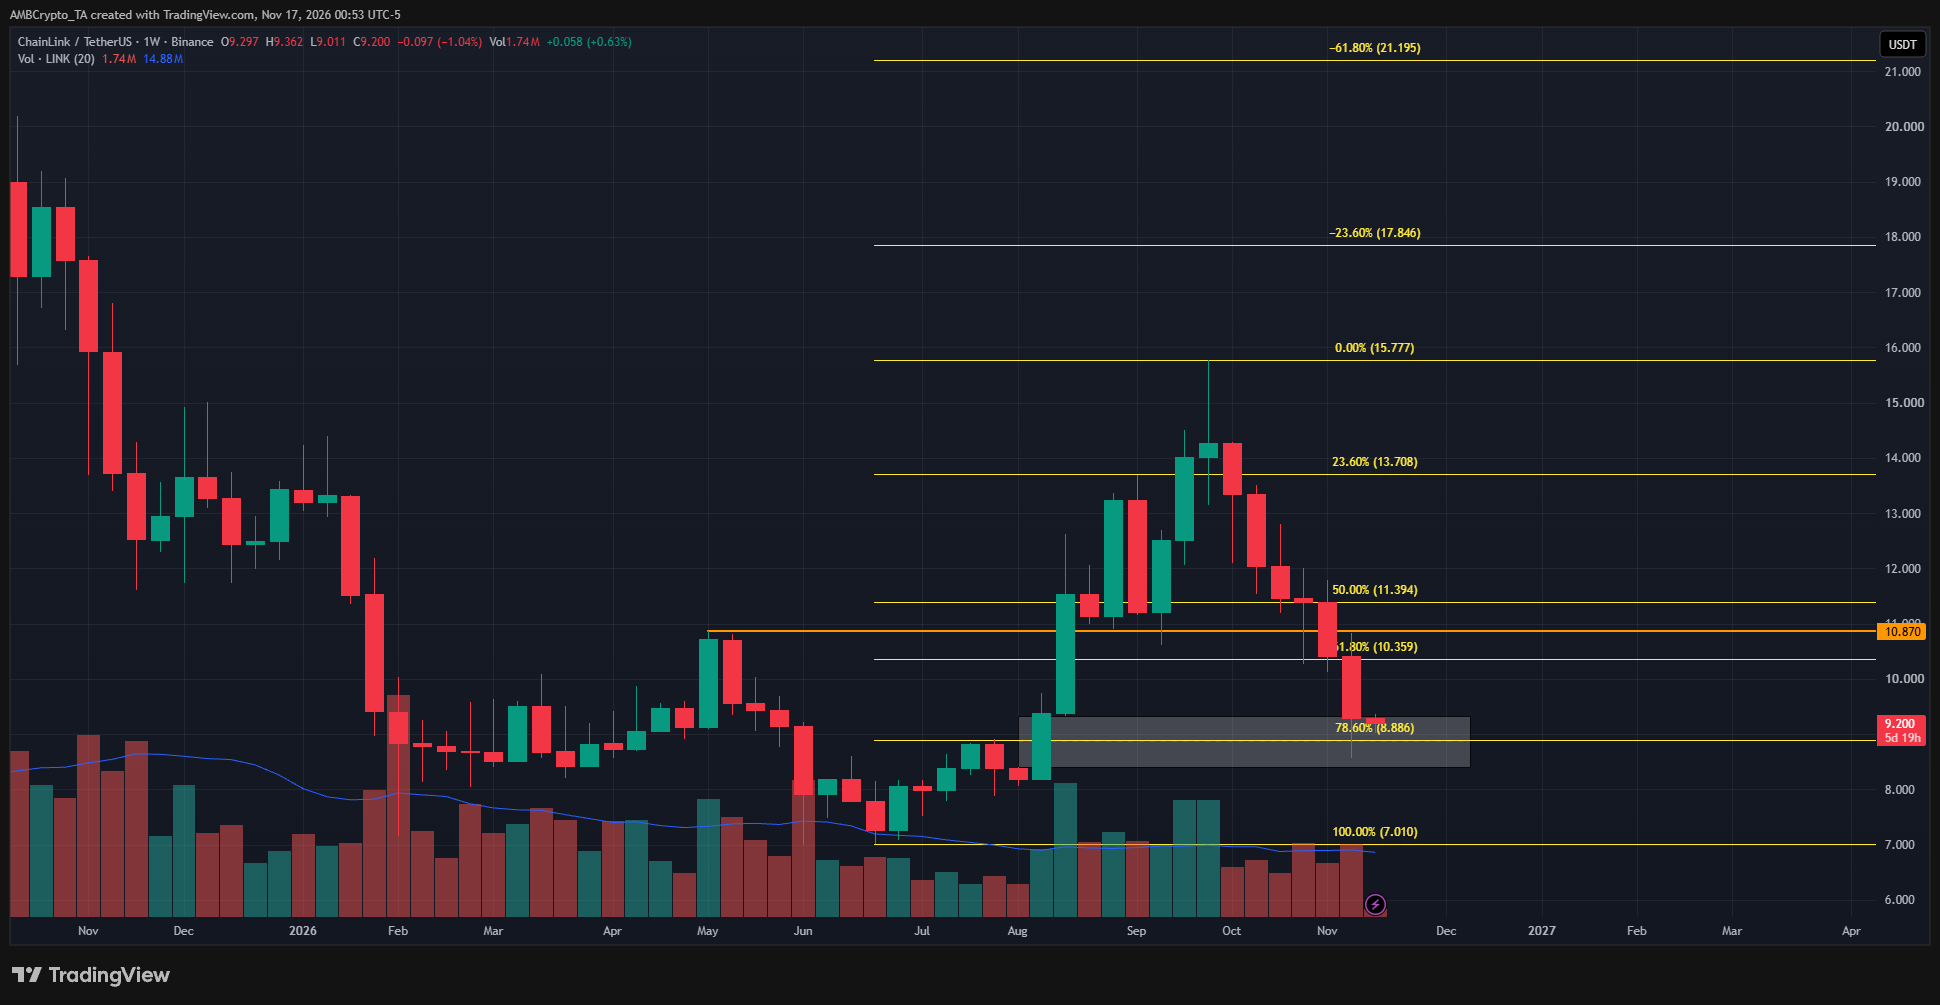
The weekly structure was bullish, though the altcoin has witnessed a deep correction. Using the impulse move higher to $15.77 earlier this year, Fibonacci retracement levels were plotted.
Additionally, this rally in August had also left behind an imbalance (white) that was being tested at the time of writing.
A bullish reaction from $8.88, the 78.6% retracement level inside the fair value gap, would be a strong sign of a bullish reversal. However, a weekly session close below $8.40 would be a warning sign that bearish pressure remained dominant.
Final Summary
- Chainlink faced heightened spot trading volume during its 25% price decline that began in late September, showing heightened selling pressure.
- The price correction has reached a pivotal demand zone on the weekly chart, and a bullish reaction from here appears likely.