Why Dogecoin will continue its downtrend after late-June rally
Dogecoin saw a large bounce on the price chart late in June but it was not enough to fend off the sellers who entered the market as it hit the $0.07 mark.

Disclaimer: The information presented does not constitute financial, investment, trading, or other types of advice and is solely the writer’s opinion.
- Dogecoin showed short-term bullish momentum earlier this month but the bears were back on top.
- The higher timeframe resistance at the $0.073 level did not yield, meaning DOGE could see the losses climb.
Dogecoin [DOGE] was trending higher on the lower timeframe charts from late June. This short-term momentum saw the meme coin climb past the $0.07 mark, but the report highlighted that a correction could begin.
Realistic or not, here’s DOGE’s market cap in BTC’s terms
Bitcoin [BTC] saw some losses over the past week as well, which was reflected in the sentiment behind Dogecoin. The evidence at hand did not support a DOGE recovery but instead signaled that a slump toward $0.053 and $0.048 could be underway.
The Dogecoin rally to $0.0728 was valiant but likely fruitless
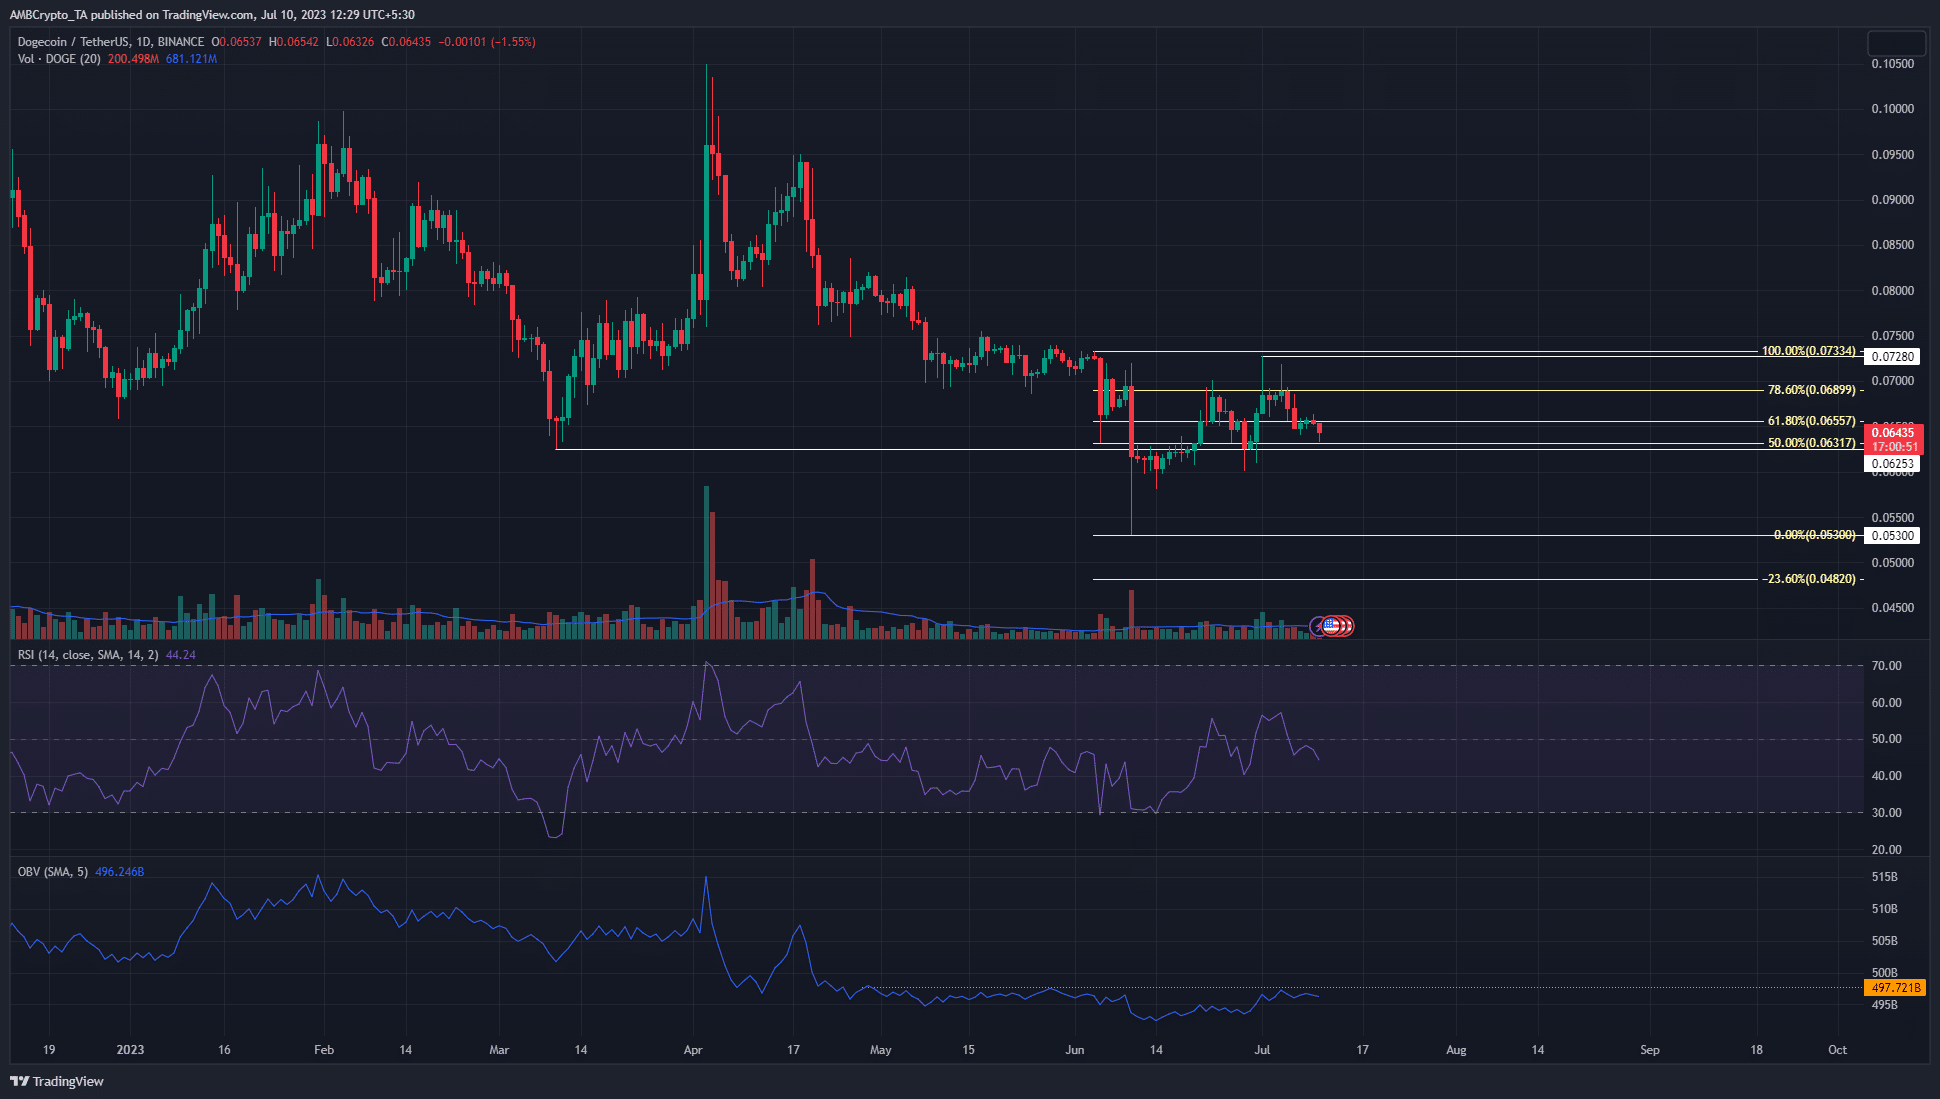
On the 1-day chart, we can see that the trend of DOGE was pointed downward. On 10 June the price fell to $0.53 but rallied to $0.728 by 1 July. This represented gains of 37.36% in three weeks. On lower timeframes such as 4-hour and 1-hour, the trend had been bullish in early July.
This began to change around 5 July. After facing rejection at $0.072 on 4 July, Dogecoin bulls were unable to defend the $0.0655 support. This drop flipped the market structure bearishly. In the 1-day chart we can see that the structure did not flip bullish at all. The brief move above $0.072 was quickly quelled by the sellers, and the 78.6% retracement level has held firm.
With DOGE below the 61.8% retracement level, it appeared that the bears were preparing to drive the prices lower once more. The RSI slipped below neutral 50 to signify a shift in momentum. The OBV was unable to breach a resistance level from May, which highlighted the lack of conviction from the buyers.
The Open Interest chart reinforced the idea of buyer weakness
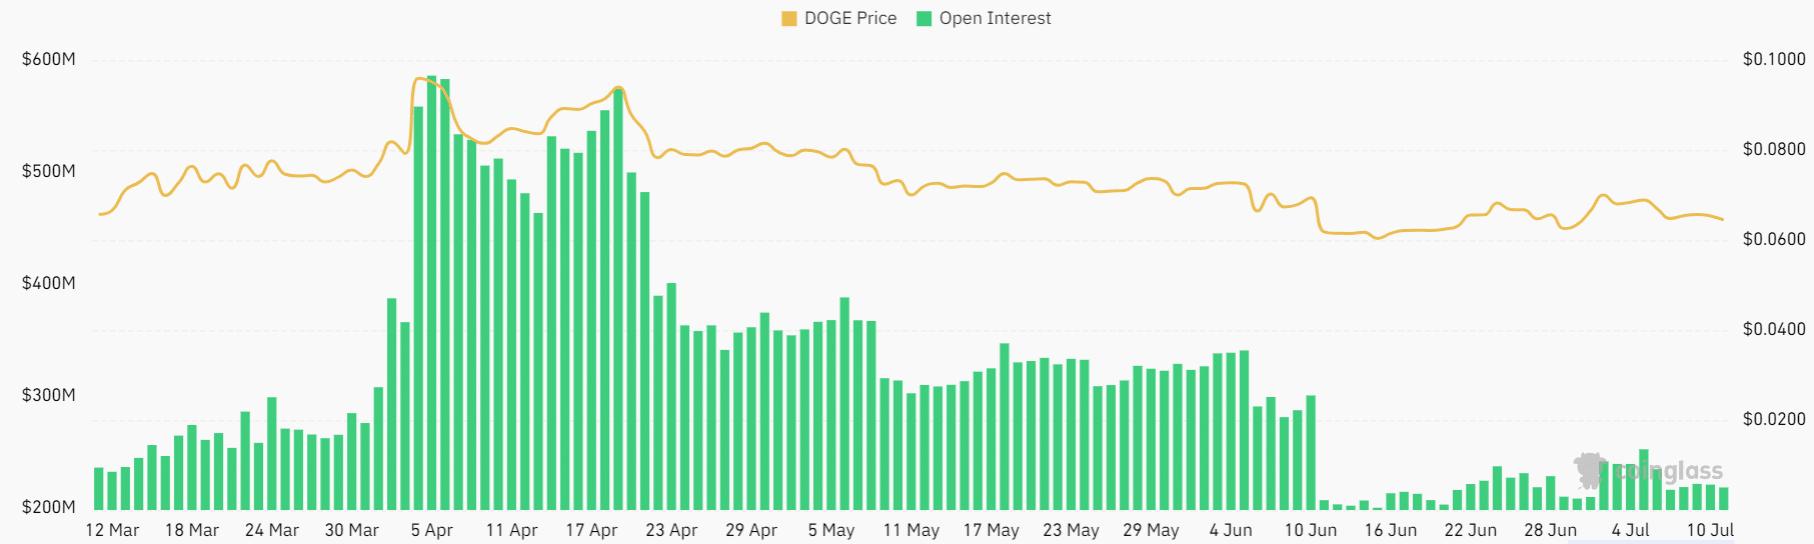
The Open Interest chart above showed that the metric rose from mid-June onward. This was when DOGE climbed above the $0.061 mark and continued higher.
Is your portfolio green? Check the Dogecoin Profit Calculator
Some buyers spotted the short-term rally and bought as prices slowly trudged higher. Yet it paled in comparison to the rally the meme coin saw in early April when Dogecoin pushed to the $0.1 level.
The lack of a strong uptrend on the OI suggested buyer confidence was low. This trend was repeated on the lower timeframes as well, according to Coinalyze data.


