Why Ethereum’s price can spiral towards $2500 over the next 7 days
Ethereum's Open Interest falls lower, suggesting that speculators are more guarded.

- Ethereum flipped its 1-day market structure bearishly.
- The former range highs were the next support region of interest.
Ethereum [ETH] saw a wave of selling activity as profit-taking arose amidst fear. The downtrend was persistent in April and the selling volume was growing.
The indicators were bearish on the one-day timeframe.
The disappointment from the Hong Kong ETFs’ volume on the first day outlined the sentiment toward ETH and crypto. The Open Interest also fell lower to suggest speculators were more guarded.
The bullish order block above $2500 next
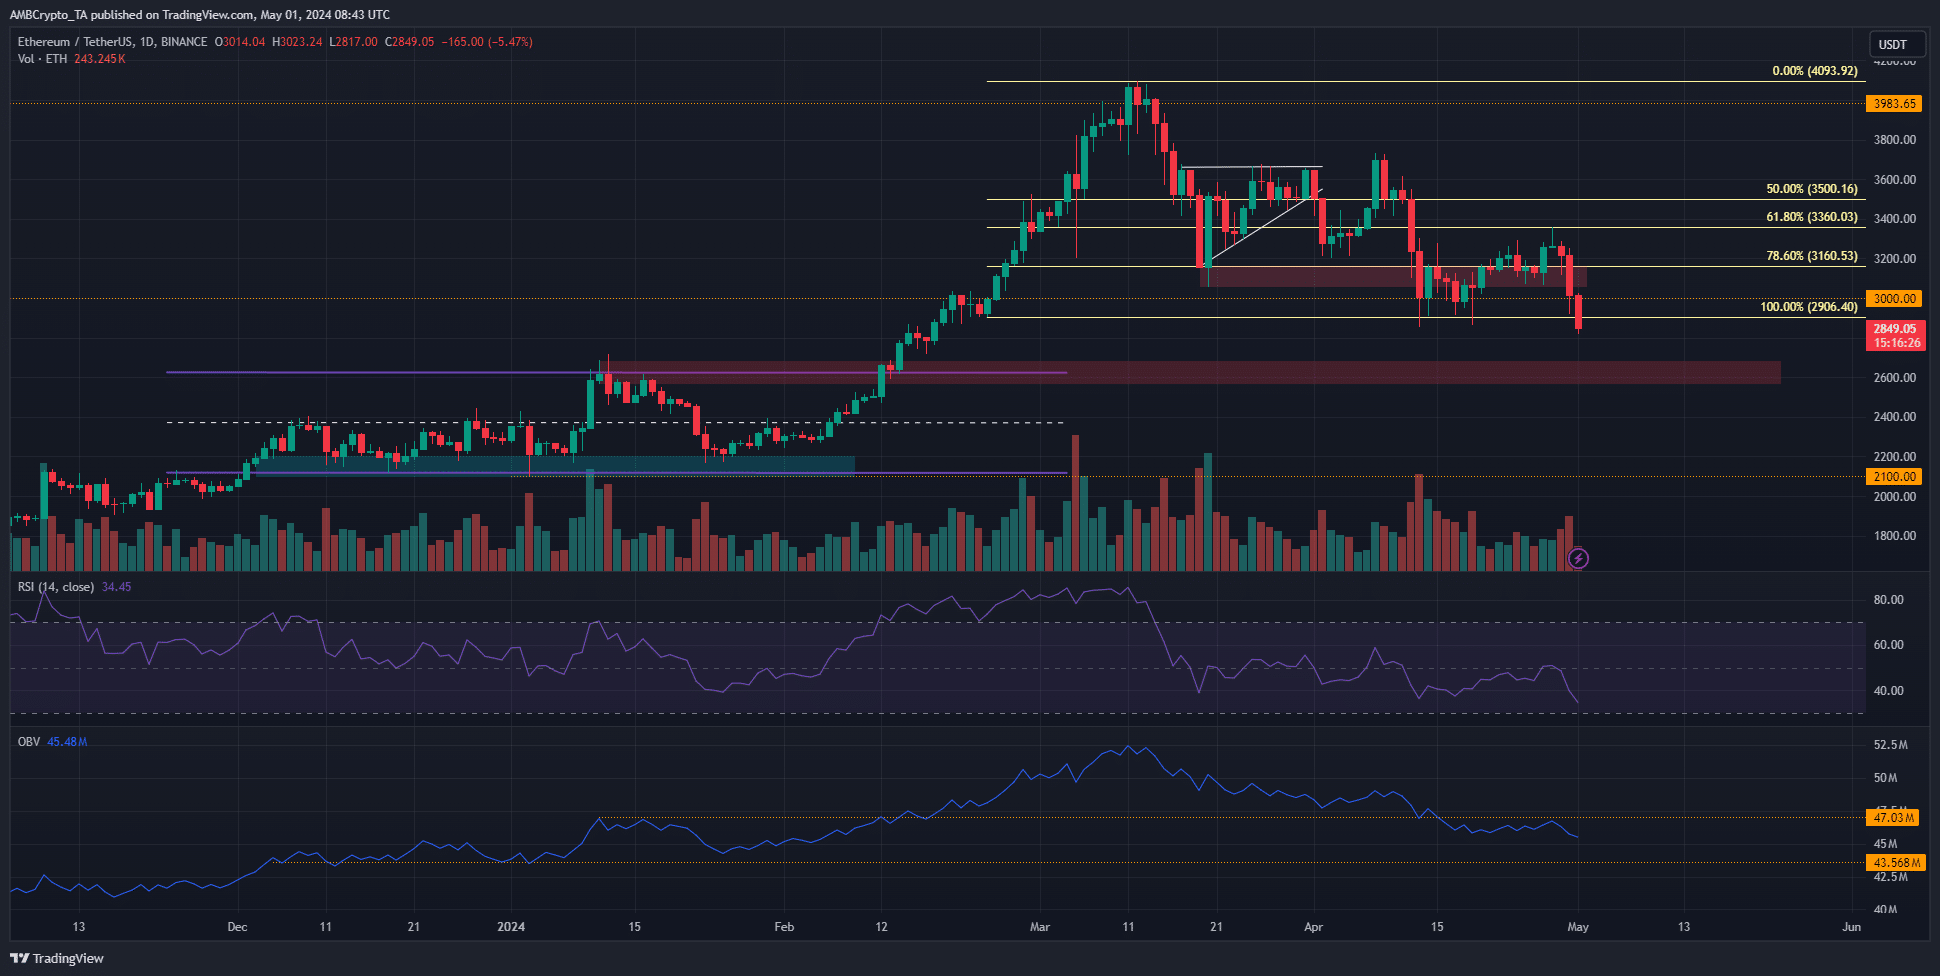
The higher timeframe trend of Ethereum flipped bearishly after it dropped below the $2906 swing low. If the daily session closes below this level, the price would very likely head toward the next support zone at $2600.
This region also has confluence with the former range highs that ETH traded within a few months ago. The RSI on the 1-day timeframe has been below neutral 50 for most of April, highlighting consistent downward momentum.
The OBV also slipped below a support level recently and retested it as resistance. Ethereum is likely to register sizeable losses before reaching the next notable level on the indicator.
The hunt for liquidity could see ETH go south
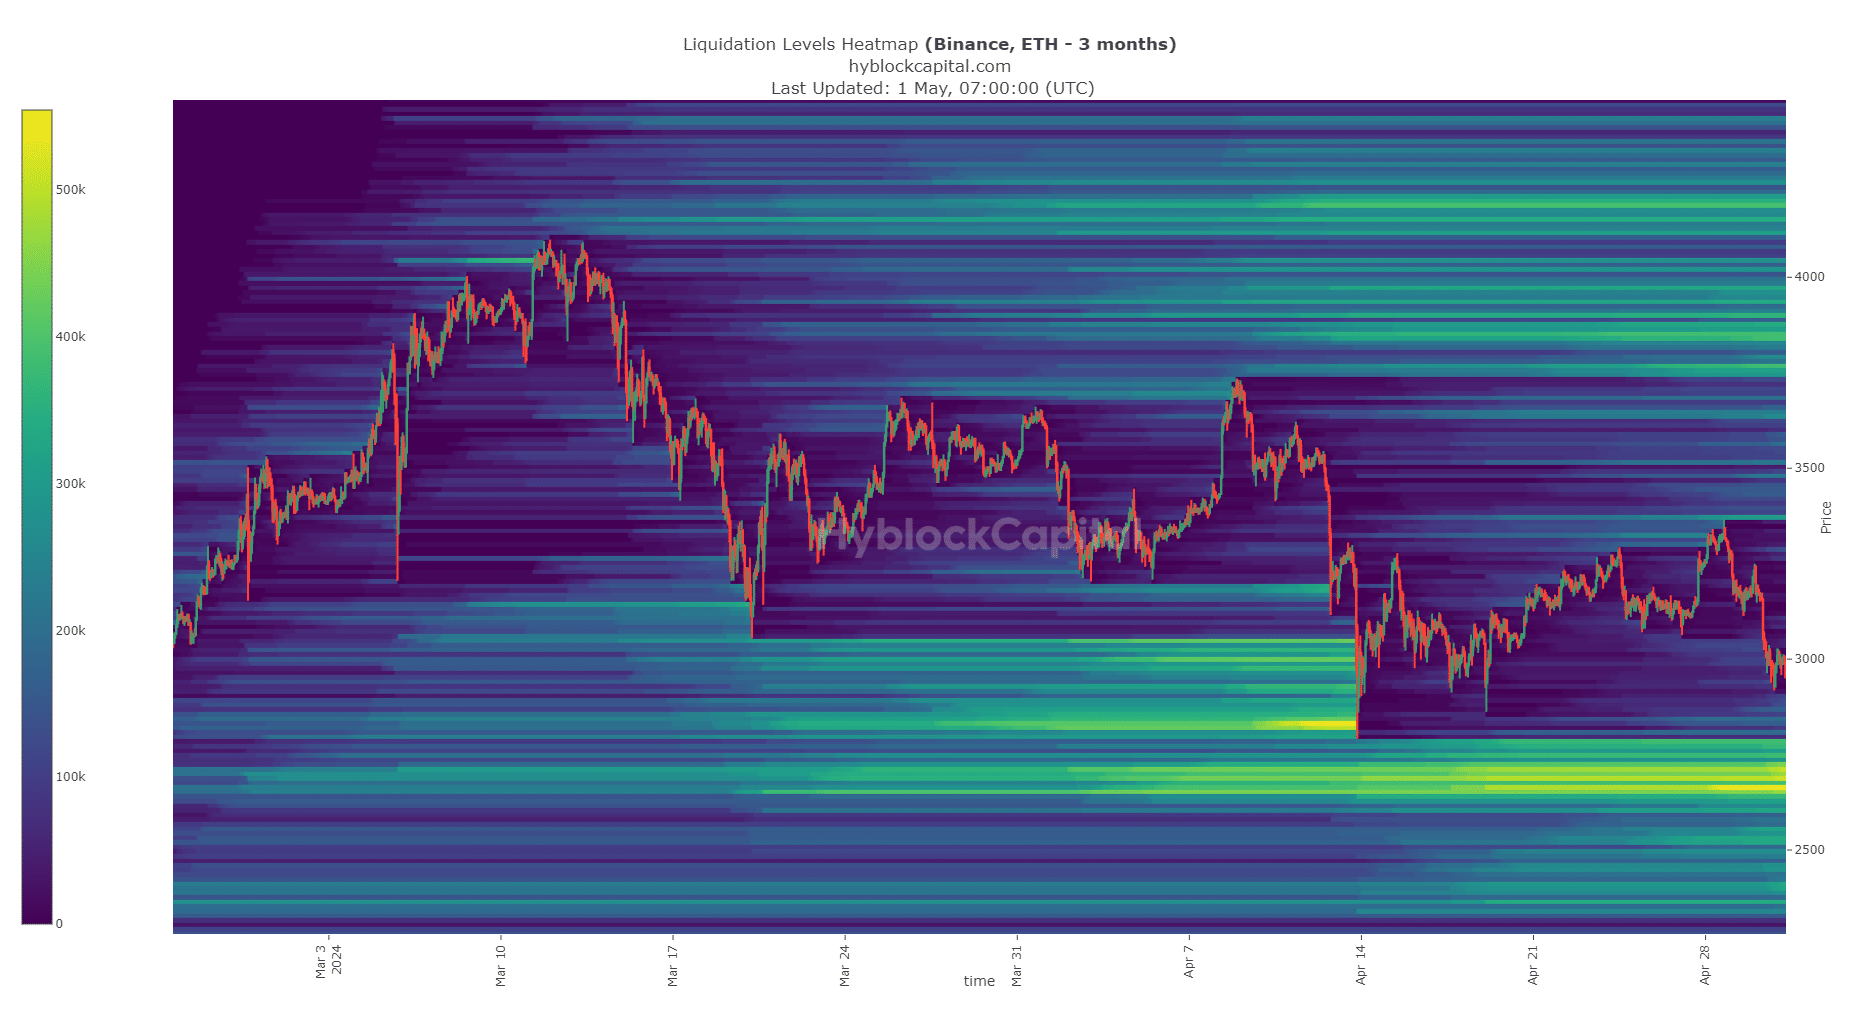
The closest cluster of liquidation levels for ETH was downward. The $2640-$2750 region presented an attractive pocket of liquidity.
Is your portfolio green? Check out the ETH Profit Calculator
It also has confluence with the bullish order block highlighted at the range highs.
It is expected that ETH will descend to this liquidity pocket before a reversal. Chances of a reversal before that were slim, since these liquidation levels act as magnetic zones to the price.
Disclaimer: The information presented does not constitute financial, investment, trading, or other types of advice and is solely the writer’s opinion.