Analysis

Why HODLing MATIC is the best bet for you right now
Posted:
| Last updated: June 17th, 2024
Journalist

- MATIC saw its daily market structure flip bearishly.
- Another 8% drop could be inbound in April.
Polygon [MATIC] saw a downtrend begin on the lower timeframe charts in the second half of March.
Bitcoin’s [BTC] recent stasis and inability to climb above $70k brought some short-term fear and selling to the altcoin markets.
Technical analysis showed that further losses were likely, and the liquidation heatmap agreed. However, the higher timeframe outlook showed bullishness could follow next month. Here’s how things could play out.
The structure shifts bearishly — should traders look to short MATIC?
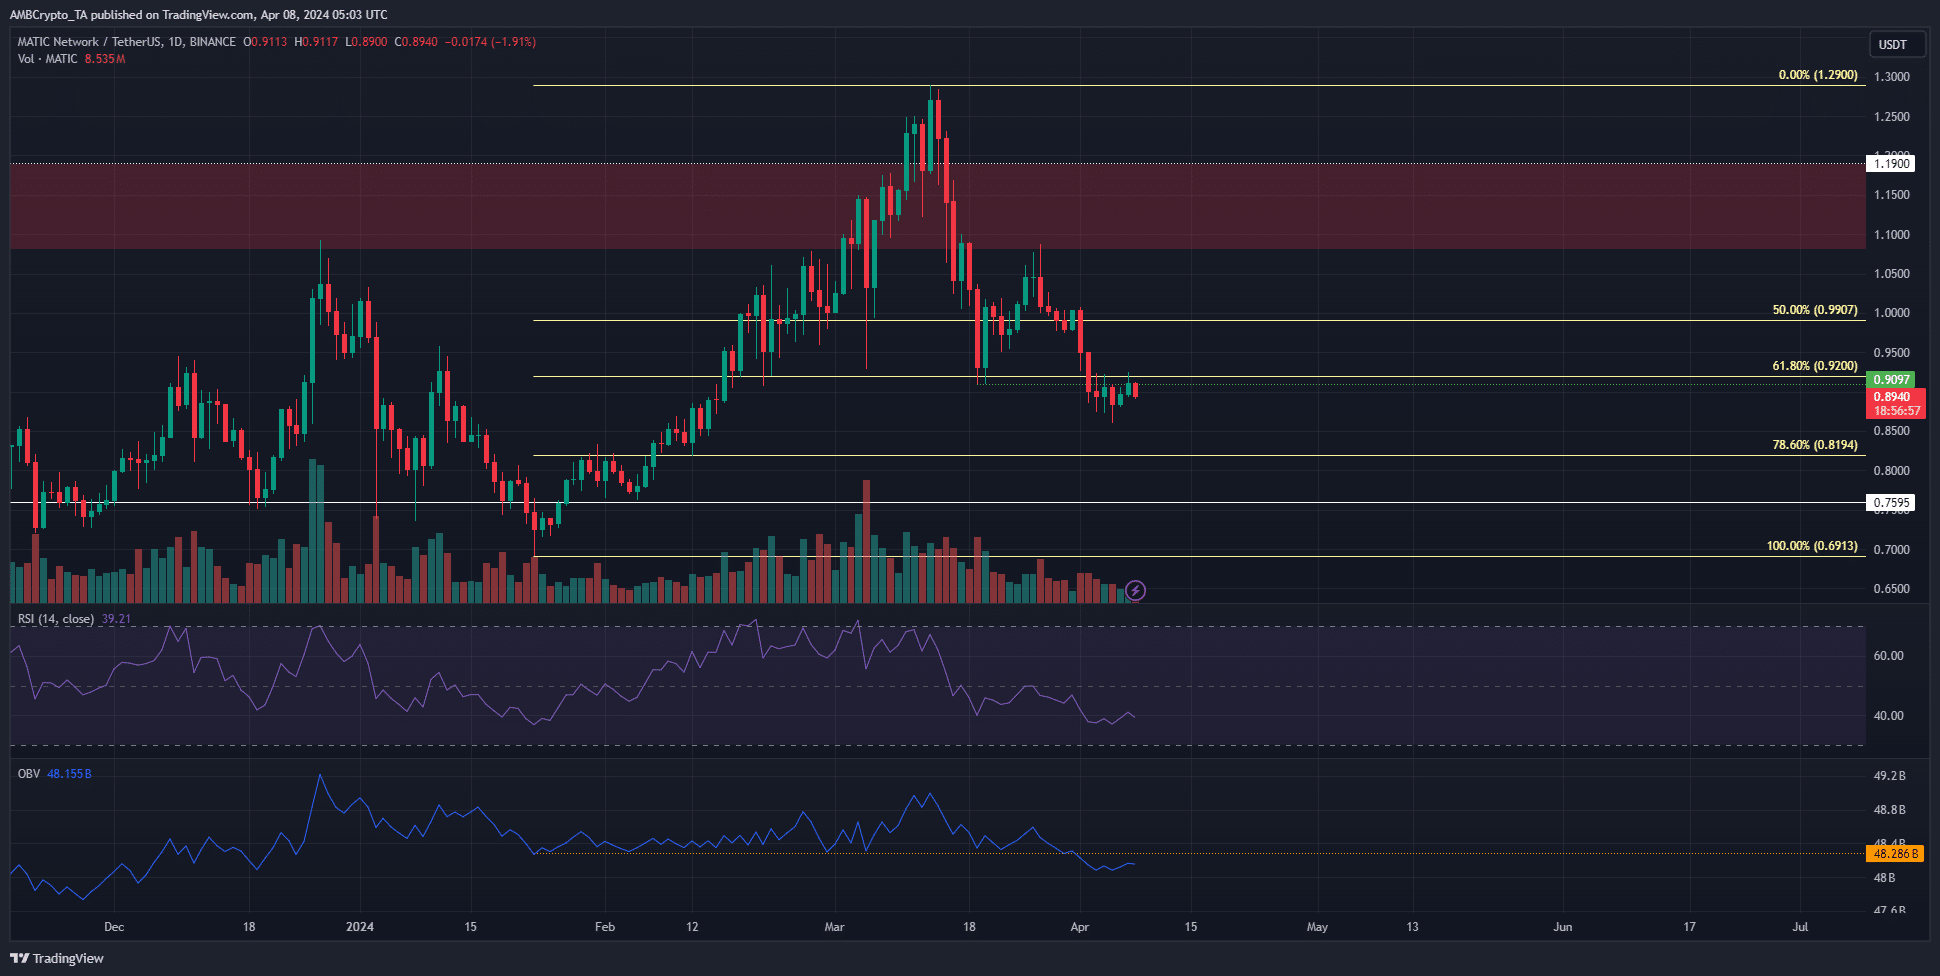
Source: MATIC/USDT on TradingView
The price of MATIC fell below the $0.91 mark on the 2nd of April. At press time, it faced rejection from the same level after retesting it as support.
This level was important because it marked the most recent higher low for the uptrend that began in November 2023.
When the structure shifted, the OBV also fell below a key support level that buyers had defended since mid-January. The RSI was also at 39, showing strong bearish momentum.
Taken together, the inference was that MATIC would very likely drop even lower and initiate a downtrend. Yet, the weekly chart had a strongly bullish bias.
Additionally, the Fibonacci 78.6% retracement level at $0.819 might halt the bears.
The liquidity pockets could play a key role shortly
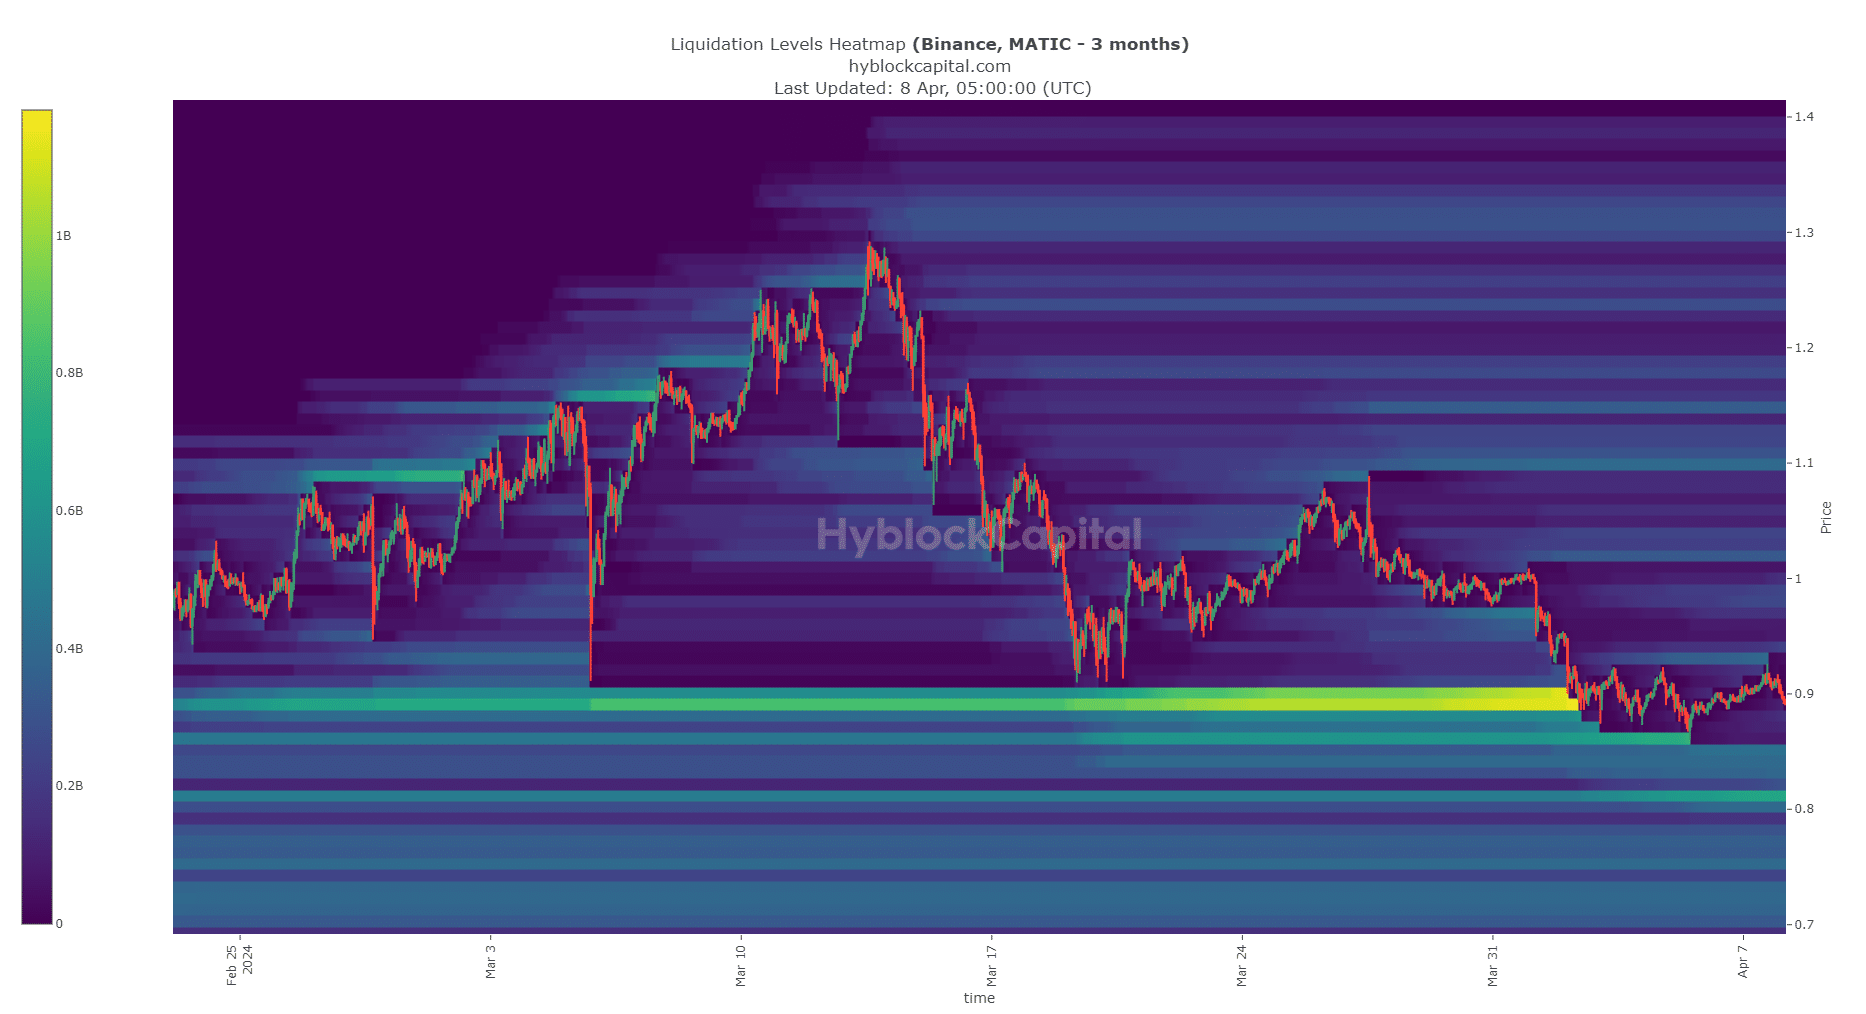
Source: Hyblock
Analysis of the liquidation heatmap showed that the high concentration of liquidation orders at $0.89 was wiped out on the 2nd of April as MATIC plunged to $0.86.
Since then, it has bounced between $0.89 and $0.92.
Is your portfolio green? Check out the MATIC Profit Calculator
The closest bunch of liquidations were at $0.81. Another area of interest was the $0.84-$0.85. The $0.81 level also coincided with the 78.6% retracement level at $0.819.
Therefore, MATIC bulls might reverse the bearish structure after sweeping this pocket of liquidity.
Disclaimer: The information presented does not constitute financial, investment, trading, or other types of advice and is solely the writer’s opinion.