Why Litecoin buyers should watch out for these levels before going long
Litecoin is testing a critical support zone—will bulls defend it and trigger a recovery or will more downside follow?

- Litecoin, at press time, was at a critical support level following a strong rejection from the 200-day EMA
- Any decline below key support levels can expose it to further losses before a likely bullish rebound
Litecoin (LTC) recently faced significant selling pressure after a sharp rejection from its 200-day EMA resistance. The altcoin has since retraced towards a key support zone, while attempting to bounce back and potentially retest higher resistance levels.
LTC was trading at $62.86 at press time, down by nearly 1.5% in the last 24 hours.
Will the bulls reclaim lost ground after the recent decline?
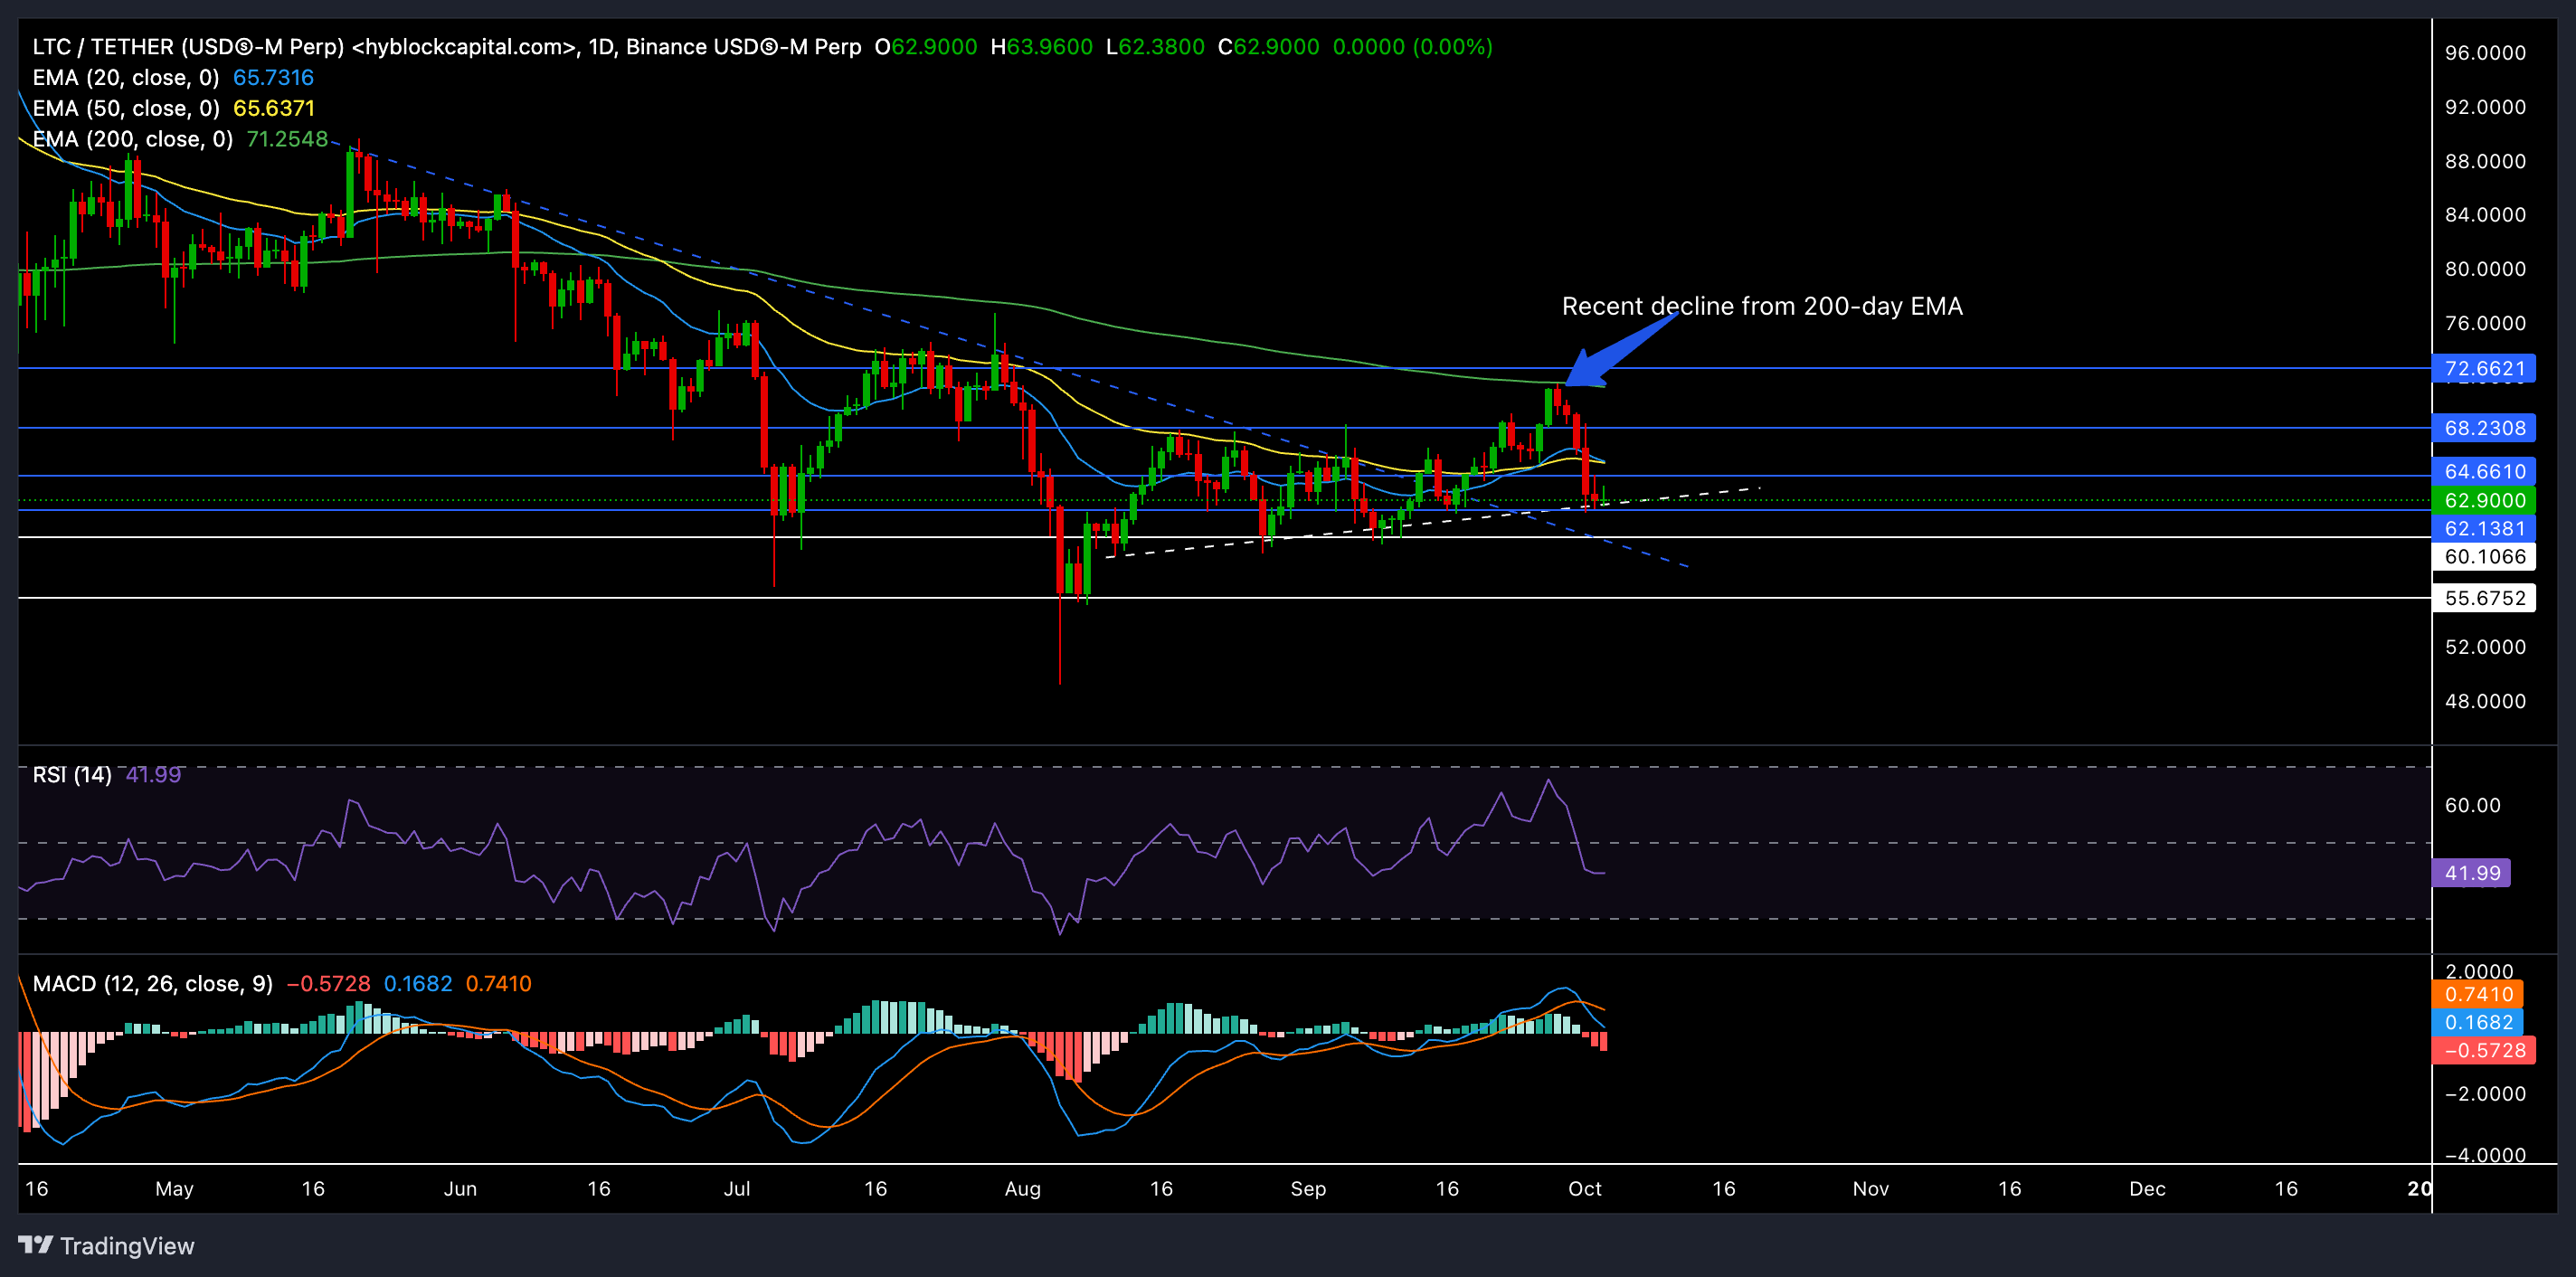
LTC recently reversed from its $71 resistance level (200-day EMA). The rejection led to a pullback toward its press time levels near the crucial support at $62. The price hovered near the convergence of the horizontal support and a trendline, making this a relatively crucial juncture for LTC’s near-term trajectory.
Here, it’s worth noting that the 20-day and 50-day EMAs have been turning south. If this trend persists and the 20-day EMA crosses below the 50-day EMA, it could mean greater selling pressure. In this scenario, the next key support zone for LTC would lie between $55 and $60.
The Relative Strength Index (RSI) hovered near 42, underlining a relatively bearish sentiment. While the RSI isn’t oversold yet, the recent pullback could imply that selling momentum might still have room to play out before the bulls regain control.
The MACD also reaffirmed the bearish momentum, as both the MACD and Signal lines looked south after a bearish crossover. A decline below the 0-mark could expose LTC to more losses in the near term.
Bulls will need to defend the $62-$63 zone to prevent further downside towards $55. However, if the broader market sentiment aligns in favor of bulls, we could see a short-term rally targeting the $68-$70 resistance region.
Derivates data revealed THIS

Volume for the same fell by 36.22% over the past day. This indicated that trading activity had tapered off, possibly reflecting high uncertainty among traders. Similarly, a slight decline of 1.31% in the Open Interest during this time suggested that traders have been cautious.
The overall long/short position was 0.9608, underlining a slight bearish edge. However, this ratio on Binance revealed a strong bullish edge too — Standing at 2.4106. This imbalance indicated traders’ optimism for a near-term recovery, though the slight short tilt could mean the possibility of more downside before a significant recovery.
Traders should monitor the behavior around the EMAs, RSI, and overall market sentiment before making any buying or selling decisions for Litecoin.