Why Polkadot remains less volatile than Dogecoin

- DOGE’s price performed better as DOT became relatively stable.
- Increasing bullish momentum could drive DOT toward $10.
Despite being three places lower than Dogecoin [DOGE] per market cap, liquidity in the Polkadot [DOT] ecosystem has become higher than the former.
According to CoinMarketCap, DOT’s liquidity score on Binance was 760. DOGE, on the other hand, had a score of 731.
The liquidity score in the cryptocurrency market ranges from zero to 1000. A perfect score of 1000 implies that the market has low slippage.
In this instance, the asset in question is less volatile, and the order size on the buy and sell side could be up to $200,000.
More for DOGE, less for DOT
On the other hand, a liquidity score of zero implies that traders are speculating a wide buy and sell price, indicating high volatility. The disparity in liquidity seems to have affected the price of DOGE and DOT.
Previously, AMBCrypto reported how Dogecoin’s price has been relatively stable for a while.
However, the last 24 hours have seen the value climb by almost 4.97%. This implies that the coin seems to be returning to its highly volatile state last recorded in 2021.
Like DOGE, the price of the Polkadot token increased. But its performance within the same period was about less than half compared to Dogecoin.
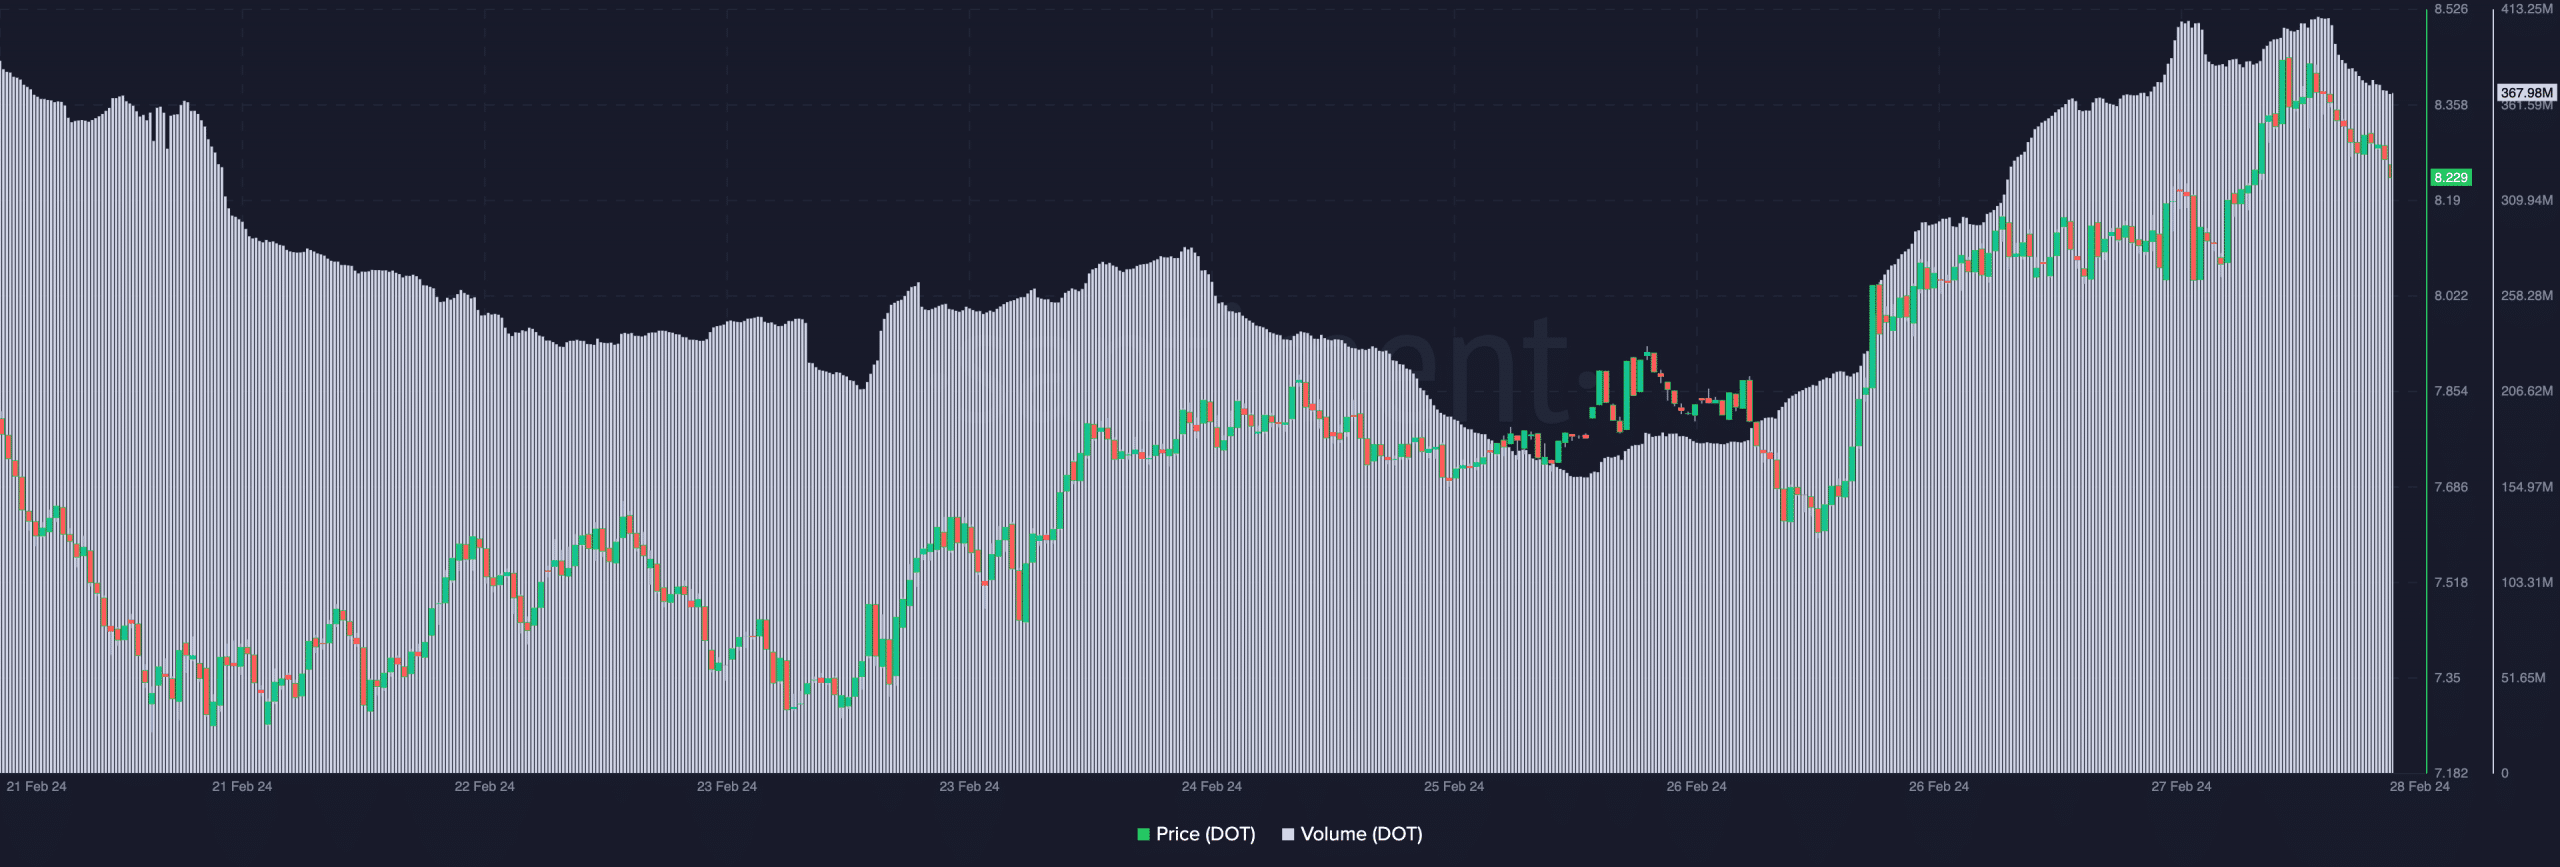
A look at on-chain data showed that DOT’s volume significantly increased over the last three days. The increase in volume suggests that more traders had been involved in buying and selling DOT.
Between the 24th and 25th of February, the volume declined, indicating winding interest in the token.
AMBCrypto’s assessment of DOT’s price in the last hour showed that it had stalled. An increasing volume and stalling price action might not be good news for a cryptocurrency’s potential rise.
Instead, it implies that the upswing had become weak, and the value might continue to fall.
Bulls set to change DOT’s status
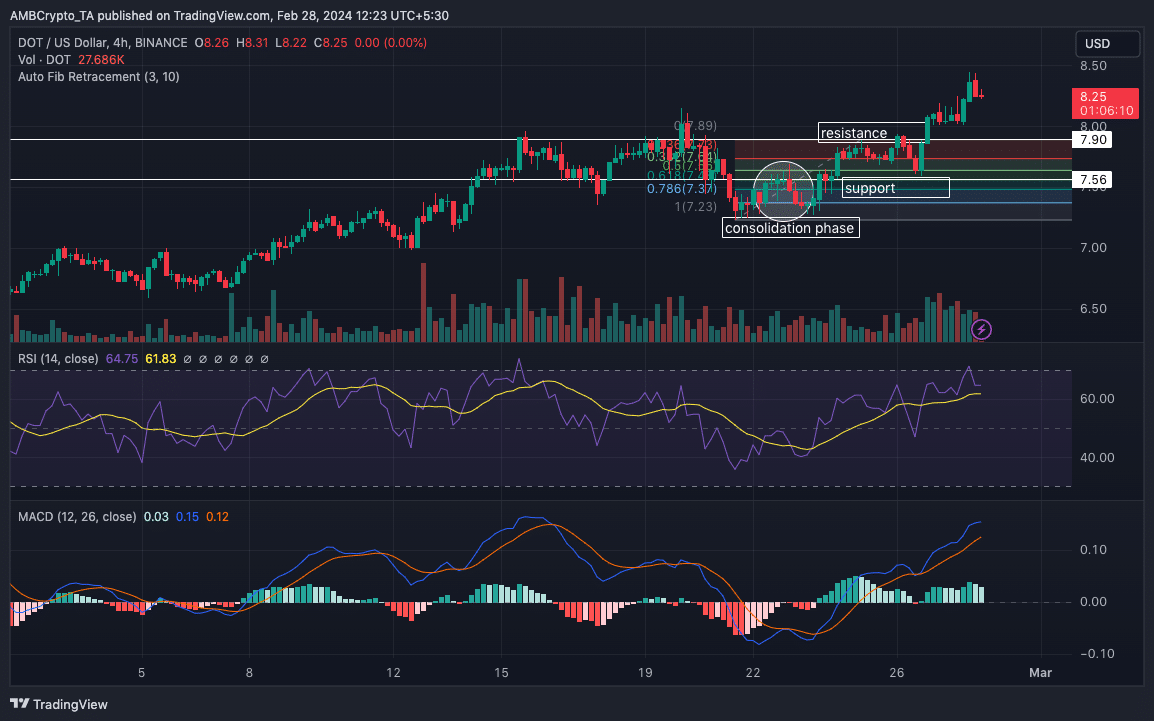
Polkadot’s price at press time was $8.25. With this in place, it was likely for it to drop below the $8 region. But we can’t be certain unless we check the technical perspective.
According to the DOT/USD chart, the token went through a consolidation phase between the 20th and 24th of February. During that time, the price moved between $7.30 and $7.65.
However, bulls were able to build support around $7.56 where the 0.618 Fibonacci retracement was located.
With increased buying pressure, DOT breached the $7.90 resistance as the price climbed above $8 later. As of this writing, the Relative Strength Index (RSI) was 64.75, indicating that buyers were still present.
Previously, the RSI hit an overbought region as its reading crossed 70.00. This caused DOT’s price to retrace from $8.44.
Furthermore, the Moving Average Convergence Divergence (MACD) was positive, suggesting a bullish momentum.
Realistic or not, here’s DOT’s market cap in DOGE terms
From the look of things, DOT’s price might pull back lower than $8. However, a quick return above the region remains an option.
If volatility around the cryptocurrency increases, then the price might climb toward $10 in the short term. If not, DOT might keep trading between $7.03 and $8.50.


