Polygon
Why Polygon [MATIC] is on track for a price rise
With historical context, the rise in supply held by large investors may echo previous rallies.

![Why Polygon [MATIC] is on track for a price rise](https://ambcrypto.com/wp-content/uploads/2024/05/polygon-news-and-mid-term-projection-1000x600.webp)
- Increased Invested Age and other metrics suggested that most MATIC holders were opting to HODL.
- High areas of liquidity existed between $0.75 and $0.78, indicating that the price could move towards these zones.
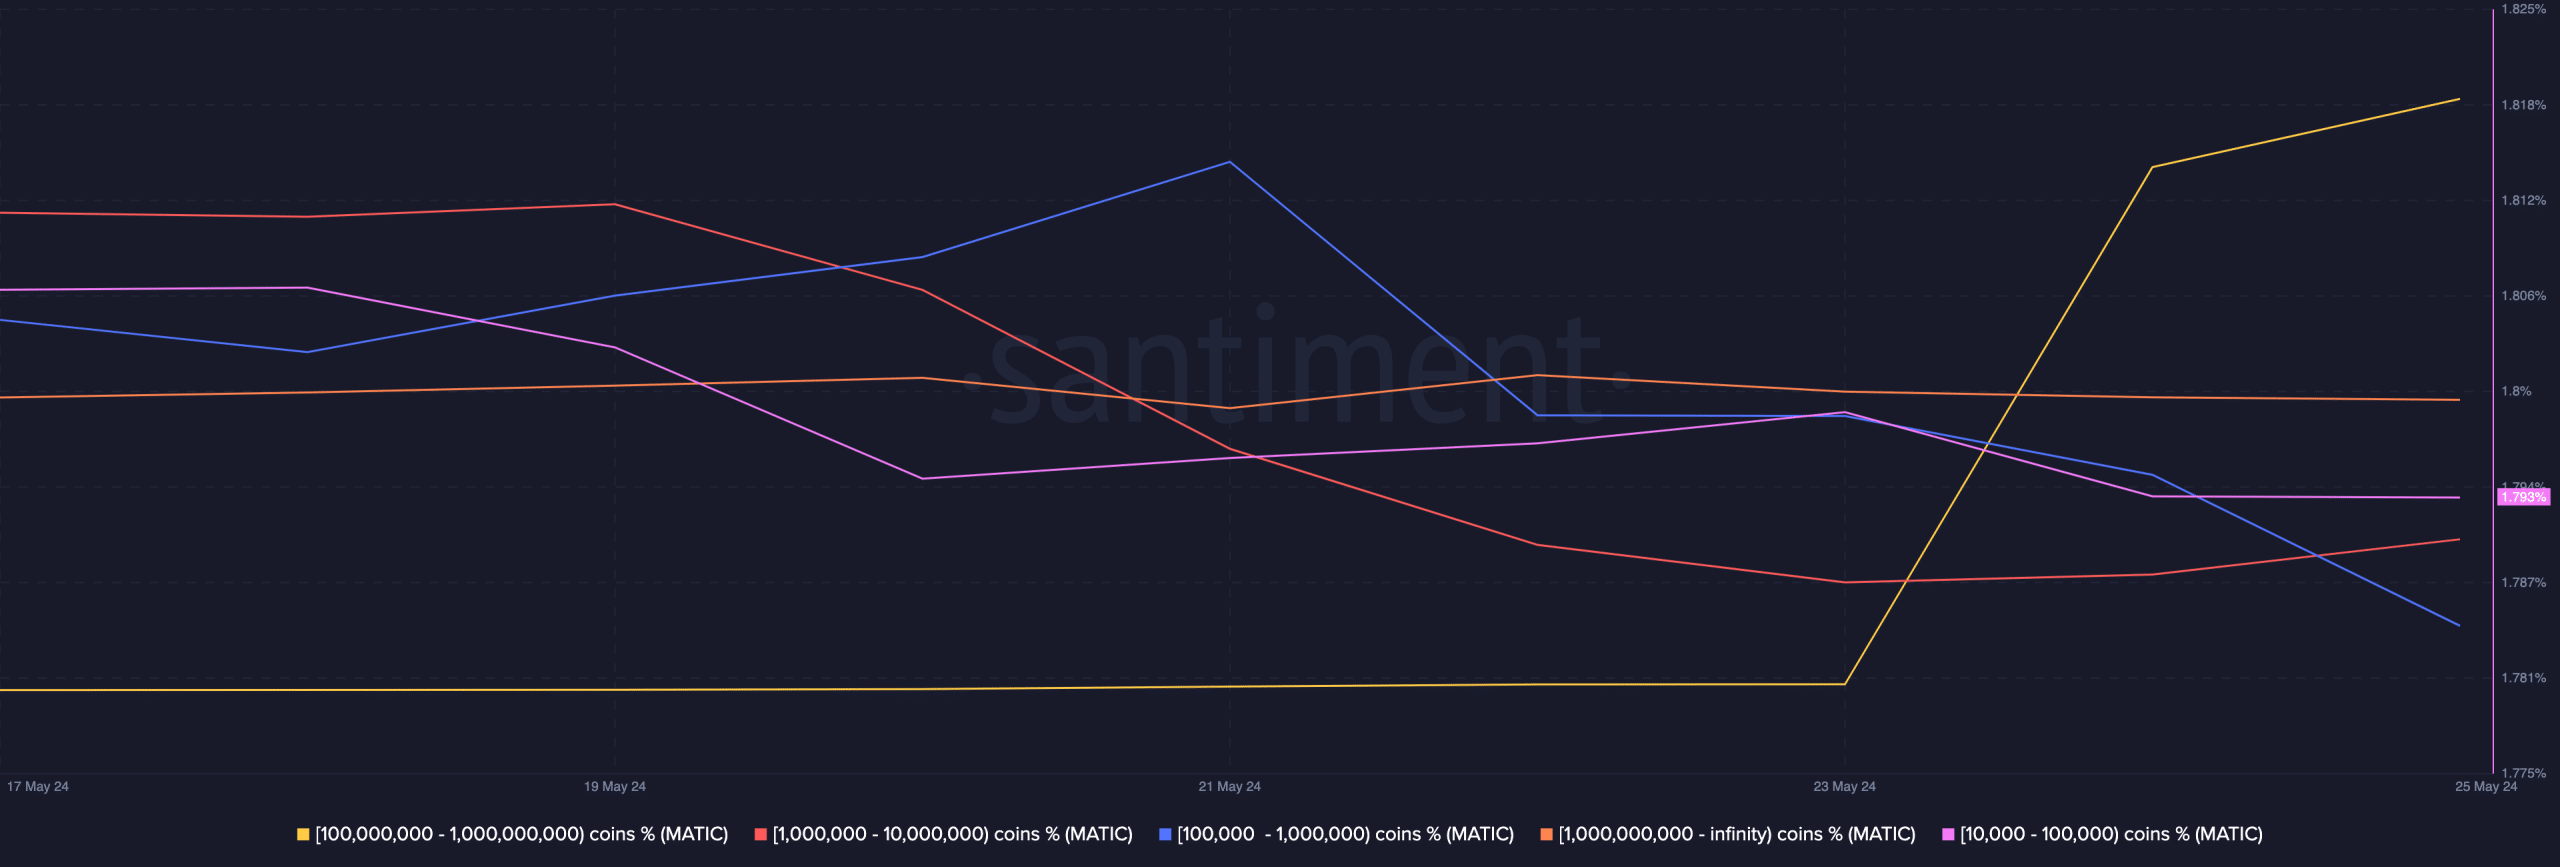
Contrary to what was happening with other groups, Polygon [MATIC] addresses holding 100 million to 1 billion tokens have been added to their balance.
This was according to data provided by Santiment. According to the on-chain analytic platform, the supply held by this cohort was 16.17% on the 23rd of May.
But as of this writing, the percentage had increased to 17.30%.
Skeptics are no longer in town
This increase denotes increasing confidence in the long-term potential
of the token. However, it could also impact MATIC’s price action in the short term.For instance, if whales (the term for the group mentioned) decide to distribute a large part of their holdings, the token involved could experience a price decrease.
Therefore, the increase in balance has the potential to drive Polygon’s price higher. At press time, the price of the token was $0.72. This was a 25.48% decline in the last 90 days.
Source: Santiment
However, MATIC has been trying to trade higher within the last month. But every attempt to reach and surpass the $0.80 resistance, has been met with rejection
.But with the recent accumulation, it could be possible for the Polygon native token to climb. Concerning this potential, AMBCrypto evaluated other metrics and indicators to see if they agreed.
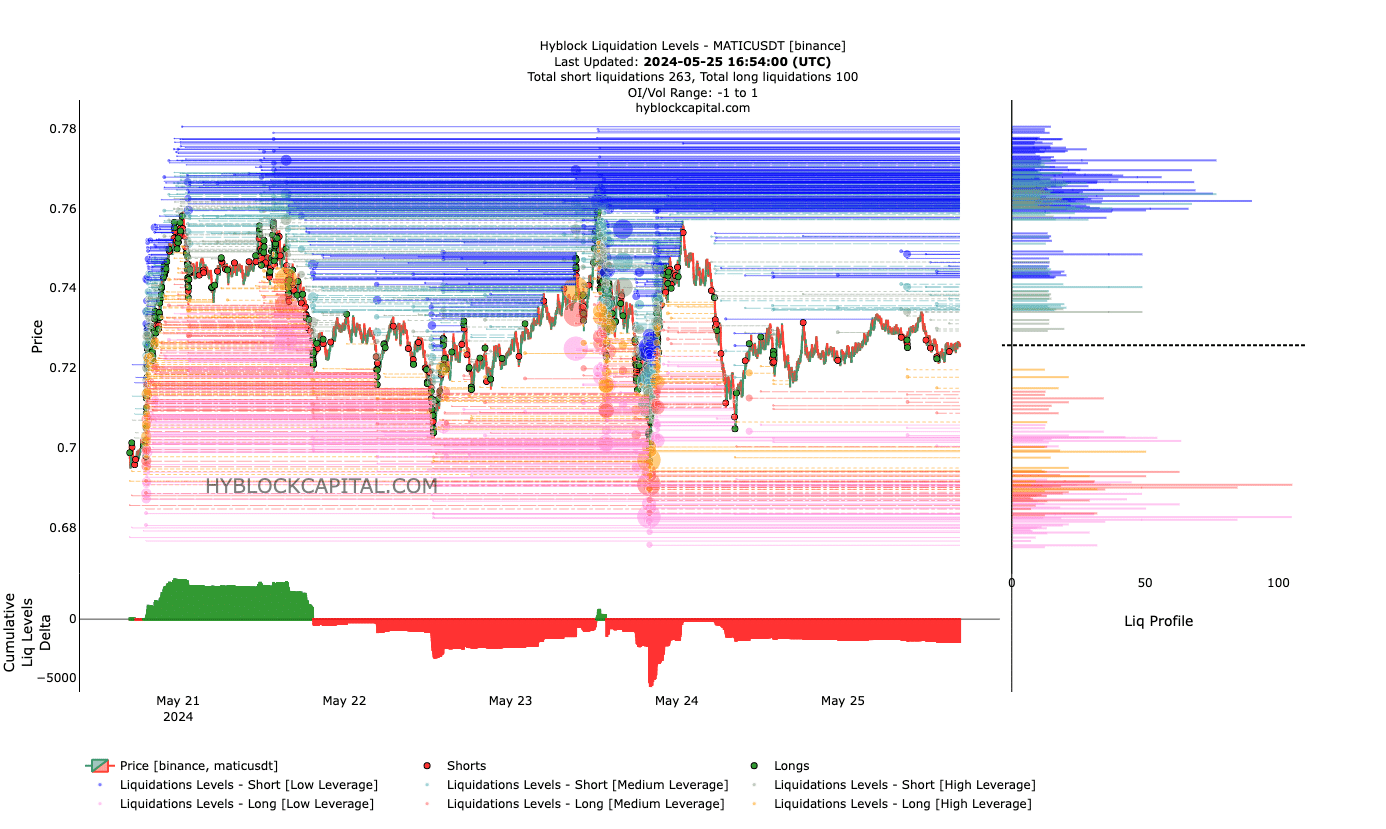
One of the indicators we looked at was the liquidation levels. This indicator shows the price levels a cryptocurrency can reach by highlighting high areas of liquidity.
As of this writing, high liquidity on the Polygon chart existed between $0.75 and $0.78. This magnetic zone indicated that the token might soon start moving in that direction.
The season of respite is coming
On the same plot, the Cumulative Liquidation Levels Delta (CLLD) validated the prediction. For context, the CLLD shows the difference between long and short liquidations.
Positive readings of the indicator suggest more long liquidations than shorts. On the other hand, a negative reading of the CLLD means that there are more short liquidations than longs.
Source: Hyblock
Apart from this, the indicator influences the price action. At press time, it was negative. For Polygon’s price, this indicated that a sharp recovery could be close, and late shorts trying to catch the dip might get punished.
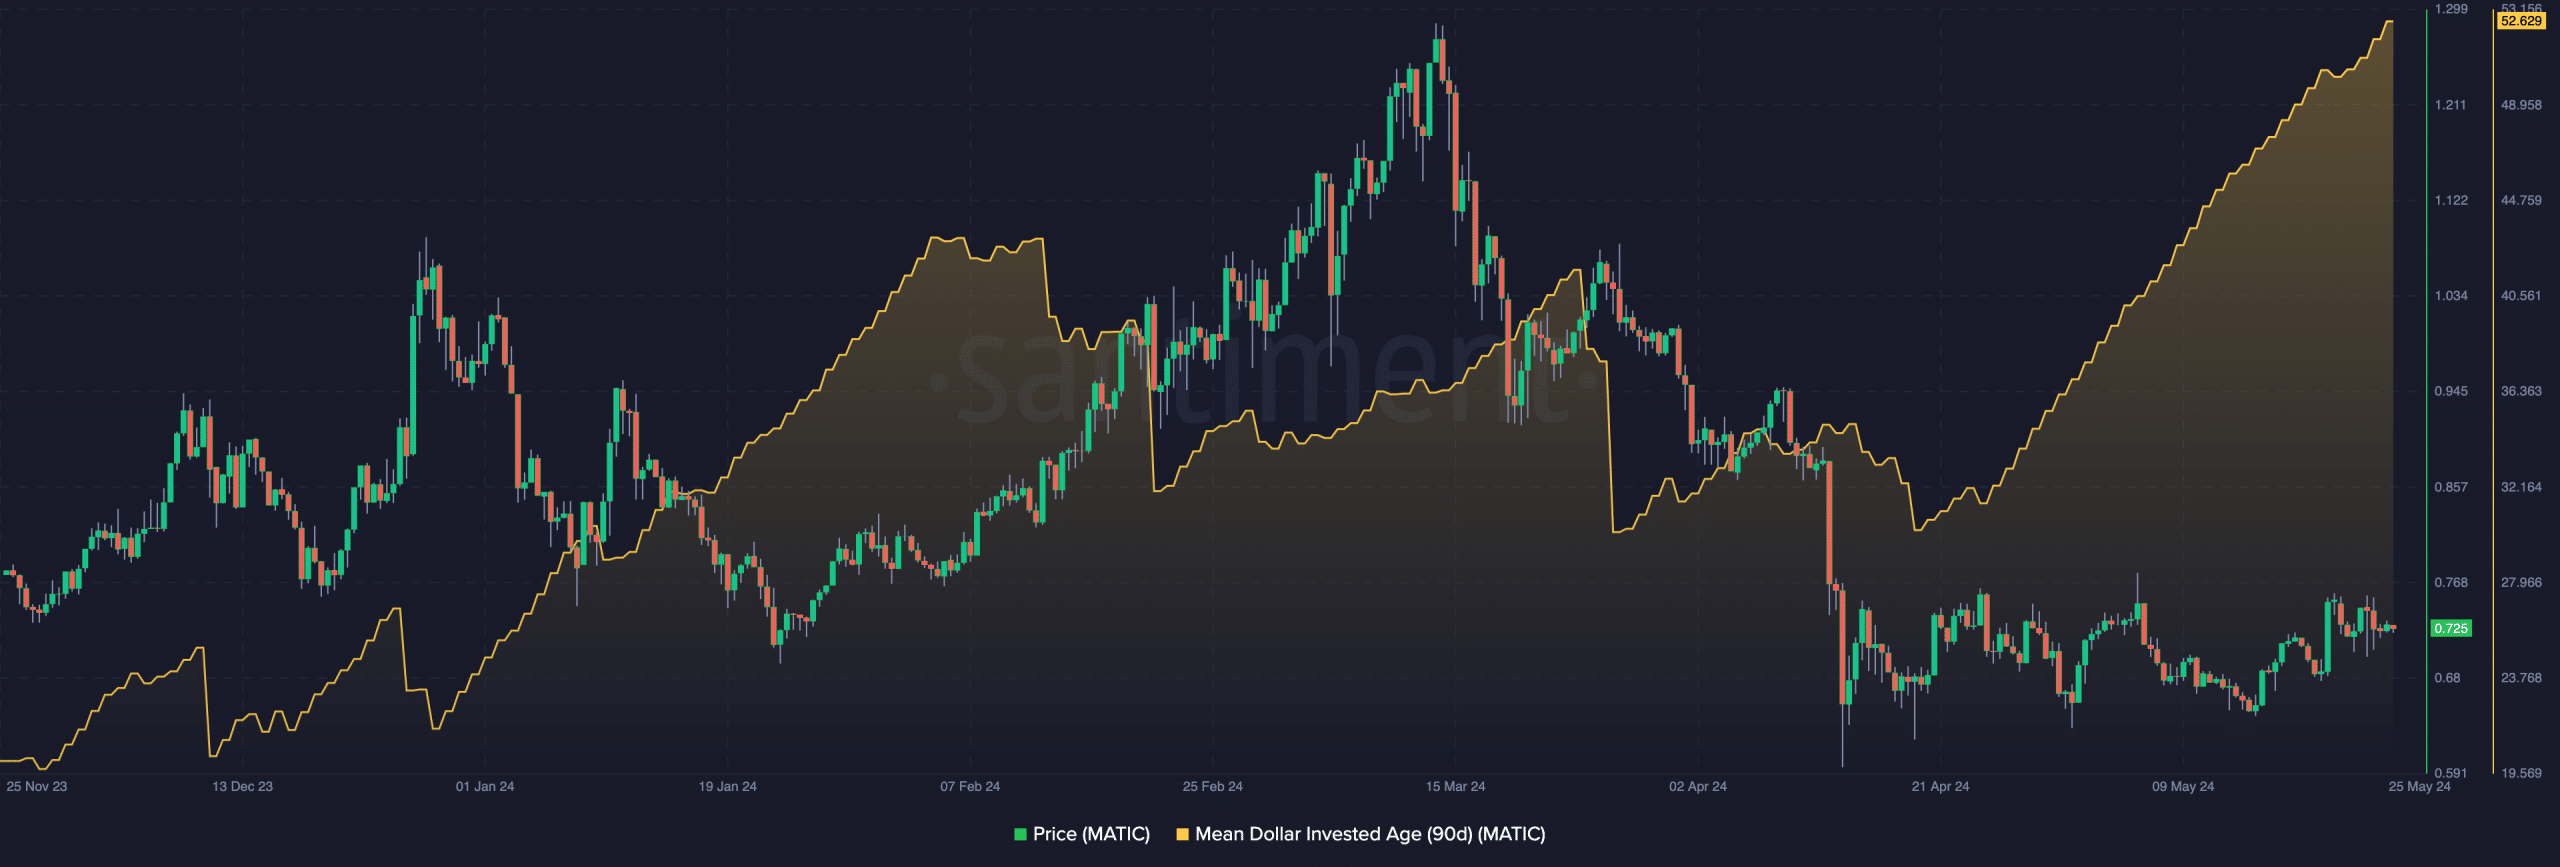
Furthermore, the Mean Dollar Invested Age (MDIA) indicated that most participants had leaned toward HODLing
MATIC. The metric shows the average time all current Polygon addresses have held their tokens.Read Polygon’s [MATIC] Price Prediction 2024-2025
If the reading of the MDIA decreases it indicates increasing transaction activity. Sometimes, this could fuel selling pressure. At press time, the 90-day MDIA increased.
Source: Santiment
The last time, the metric made such a consistent move, MATIC went from $0.71 to $1.27. While this might not be the same case this time, the price of the token might close in or surpass $1 in the midterm.


![Chainlink [LINK] price prediction - Watch out for a defense of THIS key level!](https://ambcrypto.com/wp-content/uploads/2025/04/Evans-17-min-400x240.png)