Why setting up this trade could be worth it for XRP traders

July has been a difficult month for XRP so far. The digital asset kickstarted the month with a value of $0.70 but has since retraced to a low of $0.56. Its decline was cushioned by a defensive line of $0.580- a region where XRP has lingered over the past four days. At the time of writing, XRP held the sixth spot in the crypto rankings with a market cap of $27.15 Billion.
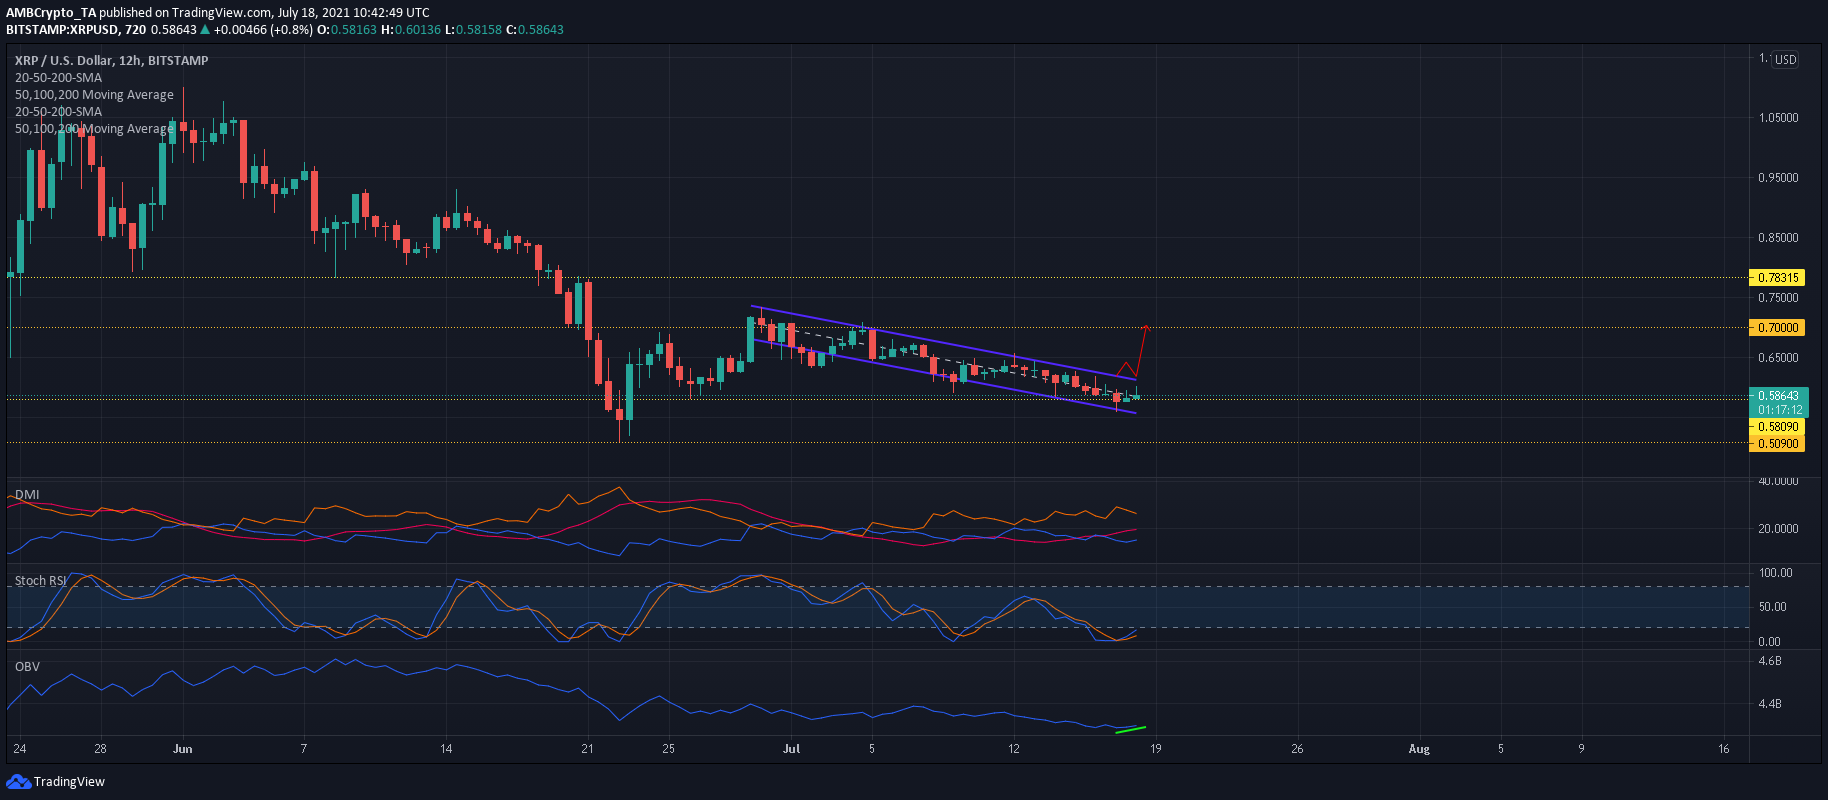
XRP 12-hour Chart

Source: XRP/USD, TradingView
The $0.580 level was a strong support region for XRP as it managed to counter several retracement stages spanning from late June to mid-July. XRP’s previous rally came in the form of a 26% price hike towards $0.73-resistance- a surge that was triggered once prices fell to $0.580. The support area was also backed by the weekly 50-SMA (not shown) why added an extra layer of defense for the bulls. The next few days could see XRP tread closer to its 20-SMA (red) and eye a potential breakout. A successful close above this moving average would likely see the cryptocurrency break north from its pattern and head towards a resistance mark of $0.70.
Reasoning
The Directional Movement Index’s +DI inched closer to the -DI and a successful crossover would be followed by a hike in buying pressure. Stochastic RSI showed a bullish crossover in the oversold region- a development that usually sees a pickup in prices. While the On Balance Volume’s larger trajectory was downwards, the last few days did note a slight pickup which meant that buying pressure outpaced selling pressure.
Conclusion
It was still early to predict a favorable outcome for XRP but the bulls were laying the starting blocks for an incoming price hike. Traders could opt to long XRP at its current price level and take-profit at $0.70, however, a safer bet would be to wait for a bullish confirmation before entering a trade- which in this case would be a rise above the 20-SMA and the $0.612 mark.


