Why Shiba Inu traders must be on the lookout for this

As anticipated in the previous article, Shiba Inu (SHIB) jumped above its 20/50/200 EMA after facing a slight pullback toward the $0.023 zone. This rally, however, could not sustain beyond the bounds of its long-term Point of Control (POC, red). (For brevity, SHIB prices are multiplied by 1000 from here on).
If the current candle closes below the POC, SHIB bears would gain enough thrust to test the $0.025-mark before leaving any options for the bulls to step in. At press time, SHIB traded at $0.027, up by 2.65% over the last day.
SHIB Daily Chart
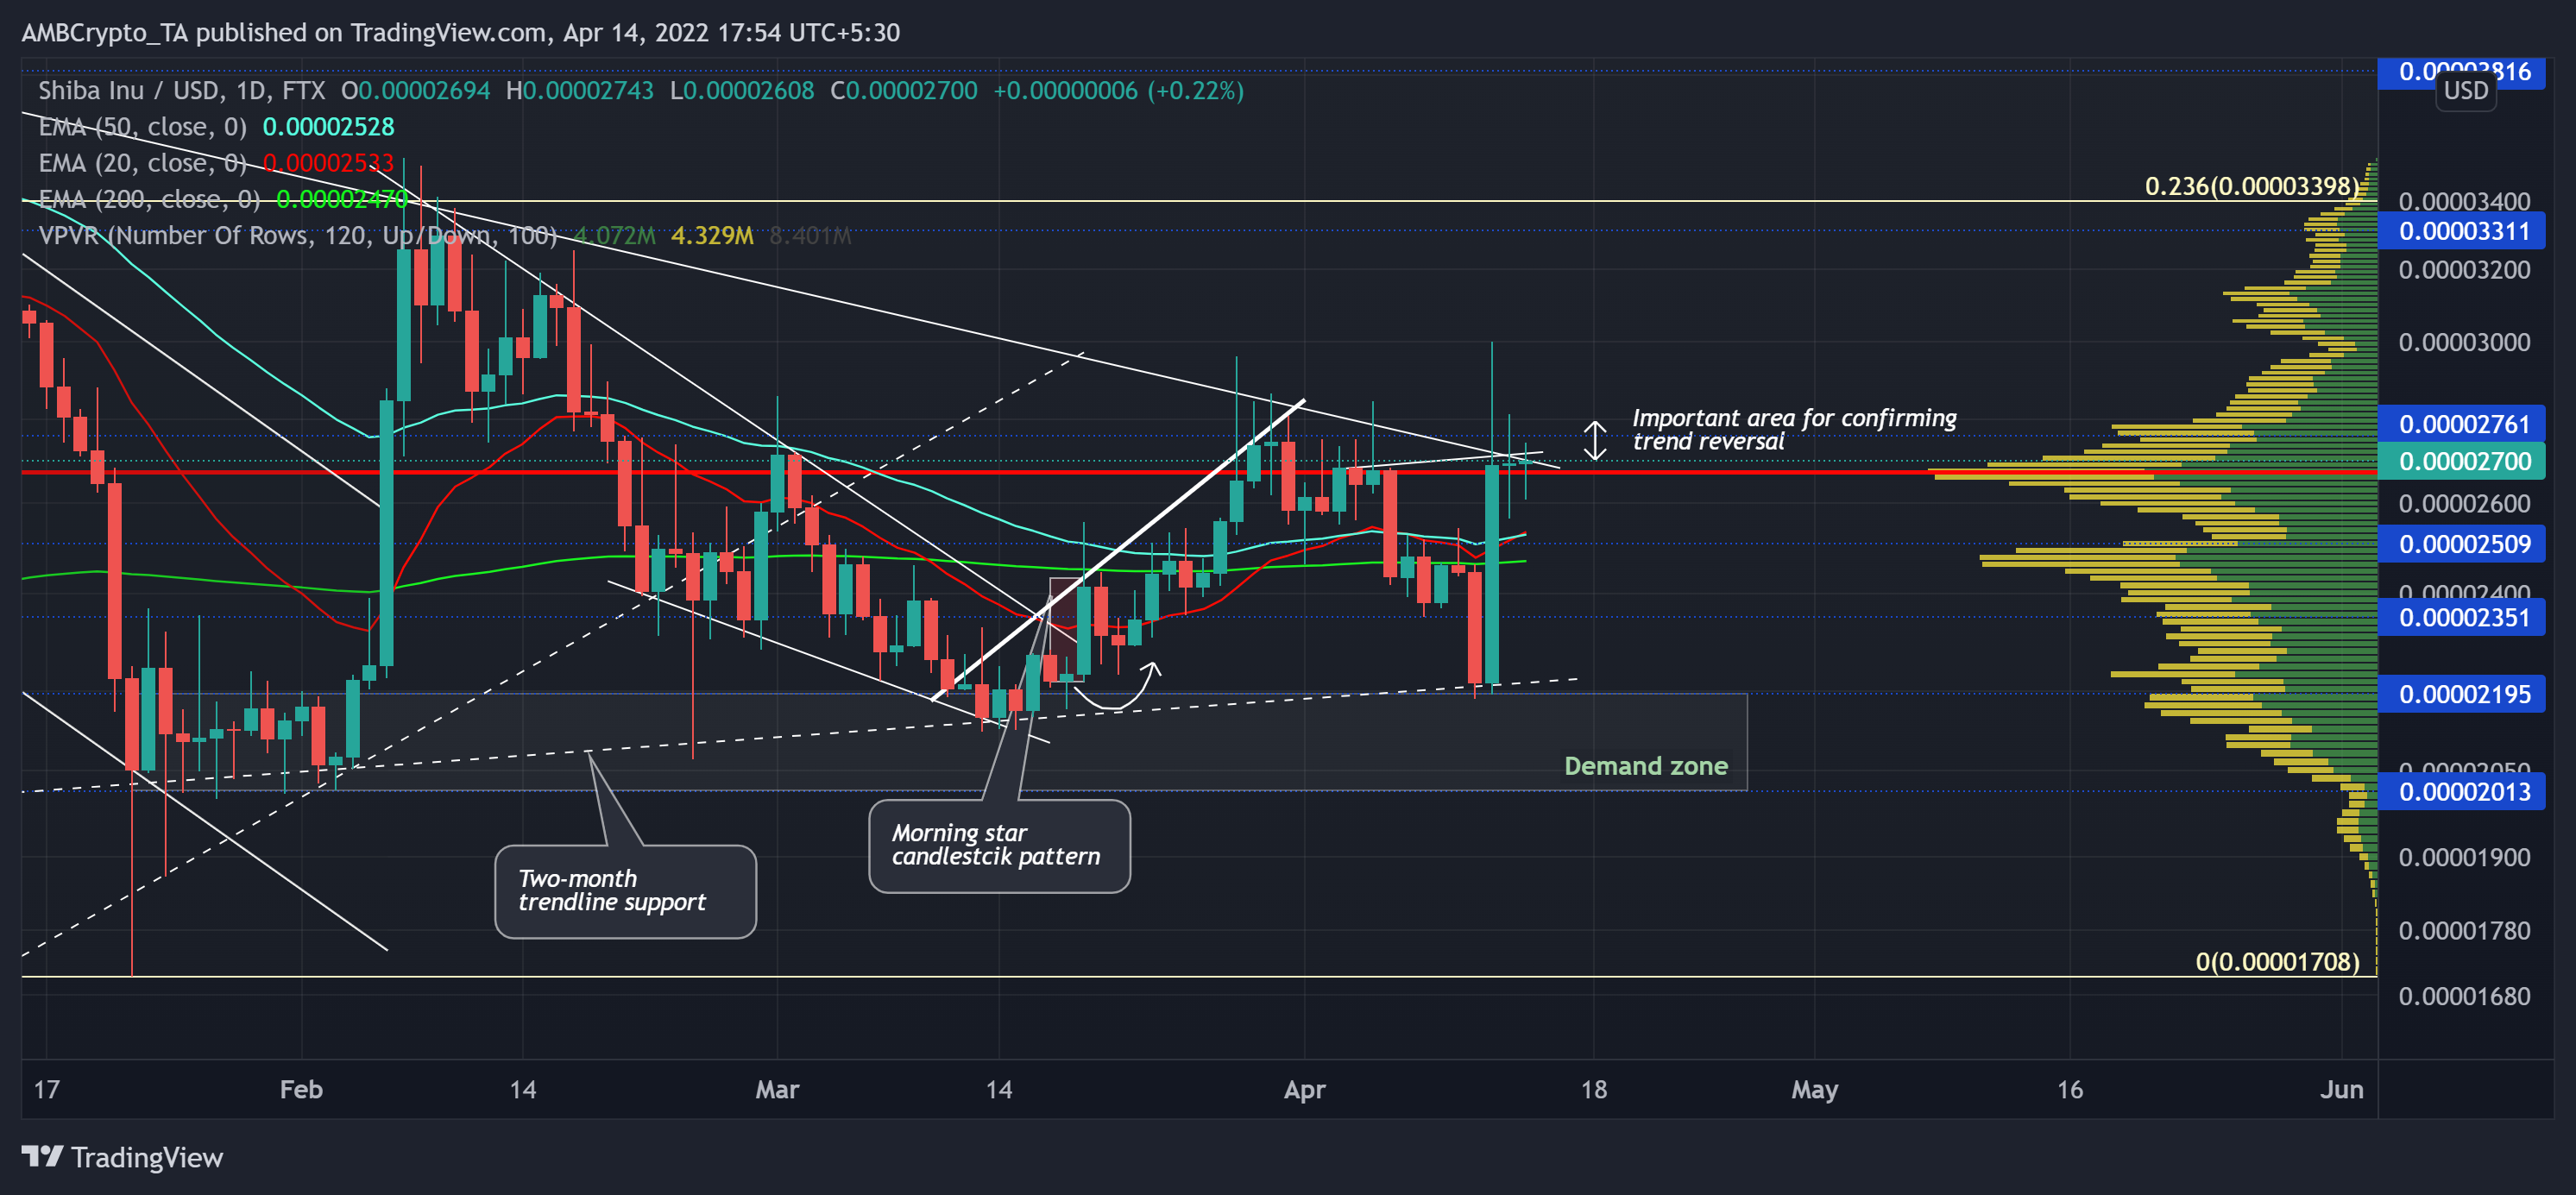
Soon after SHIB broke out of the down-channel, the 23.6% Fibonacci resistance shunned its bullish rally in early February. Meanwhile, the bulls took charge of the troughs by marking trendline support over the last three months (white, dashed).
SHIB’s retracement towards the $0.02-level completed a falling wedge pattern from where another spike was building up in the market. While its demand zone stood sturdy for nearly three months now, the patterned breakout tested the POC multiple times over the last three weeks.
Considering the recent rejection of higher prices at the $0.027-mark, a push below the POC could cause a test of the $0.025 support. A compelling close of the 20 EMA above the 50 EMA would affirm the chances of SHIB breaking the shackles of its POC in the days to come. The buyers must, however, uphold the $0.025 base and not give a free hand to the bears to test the $0.23-mark.
Rationale
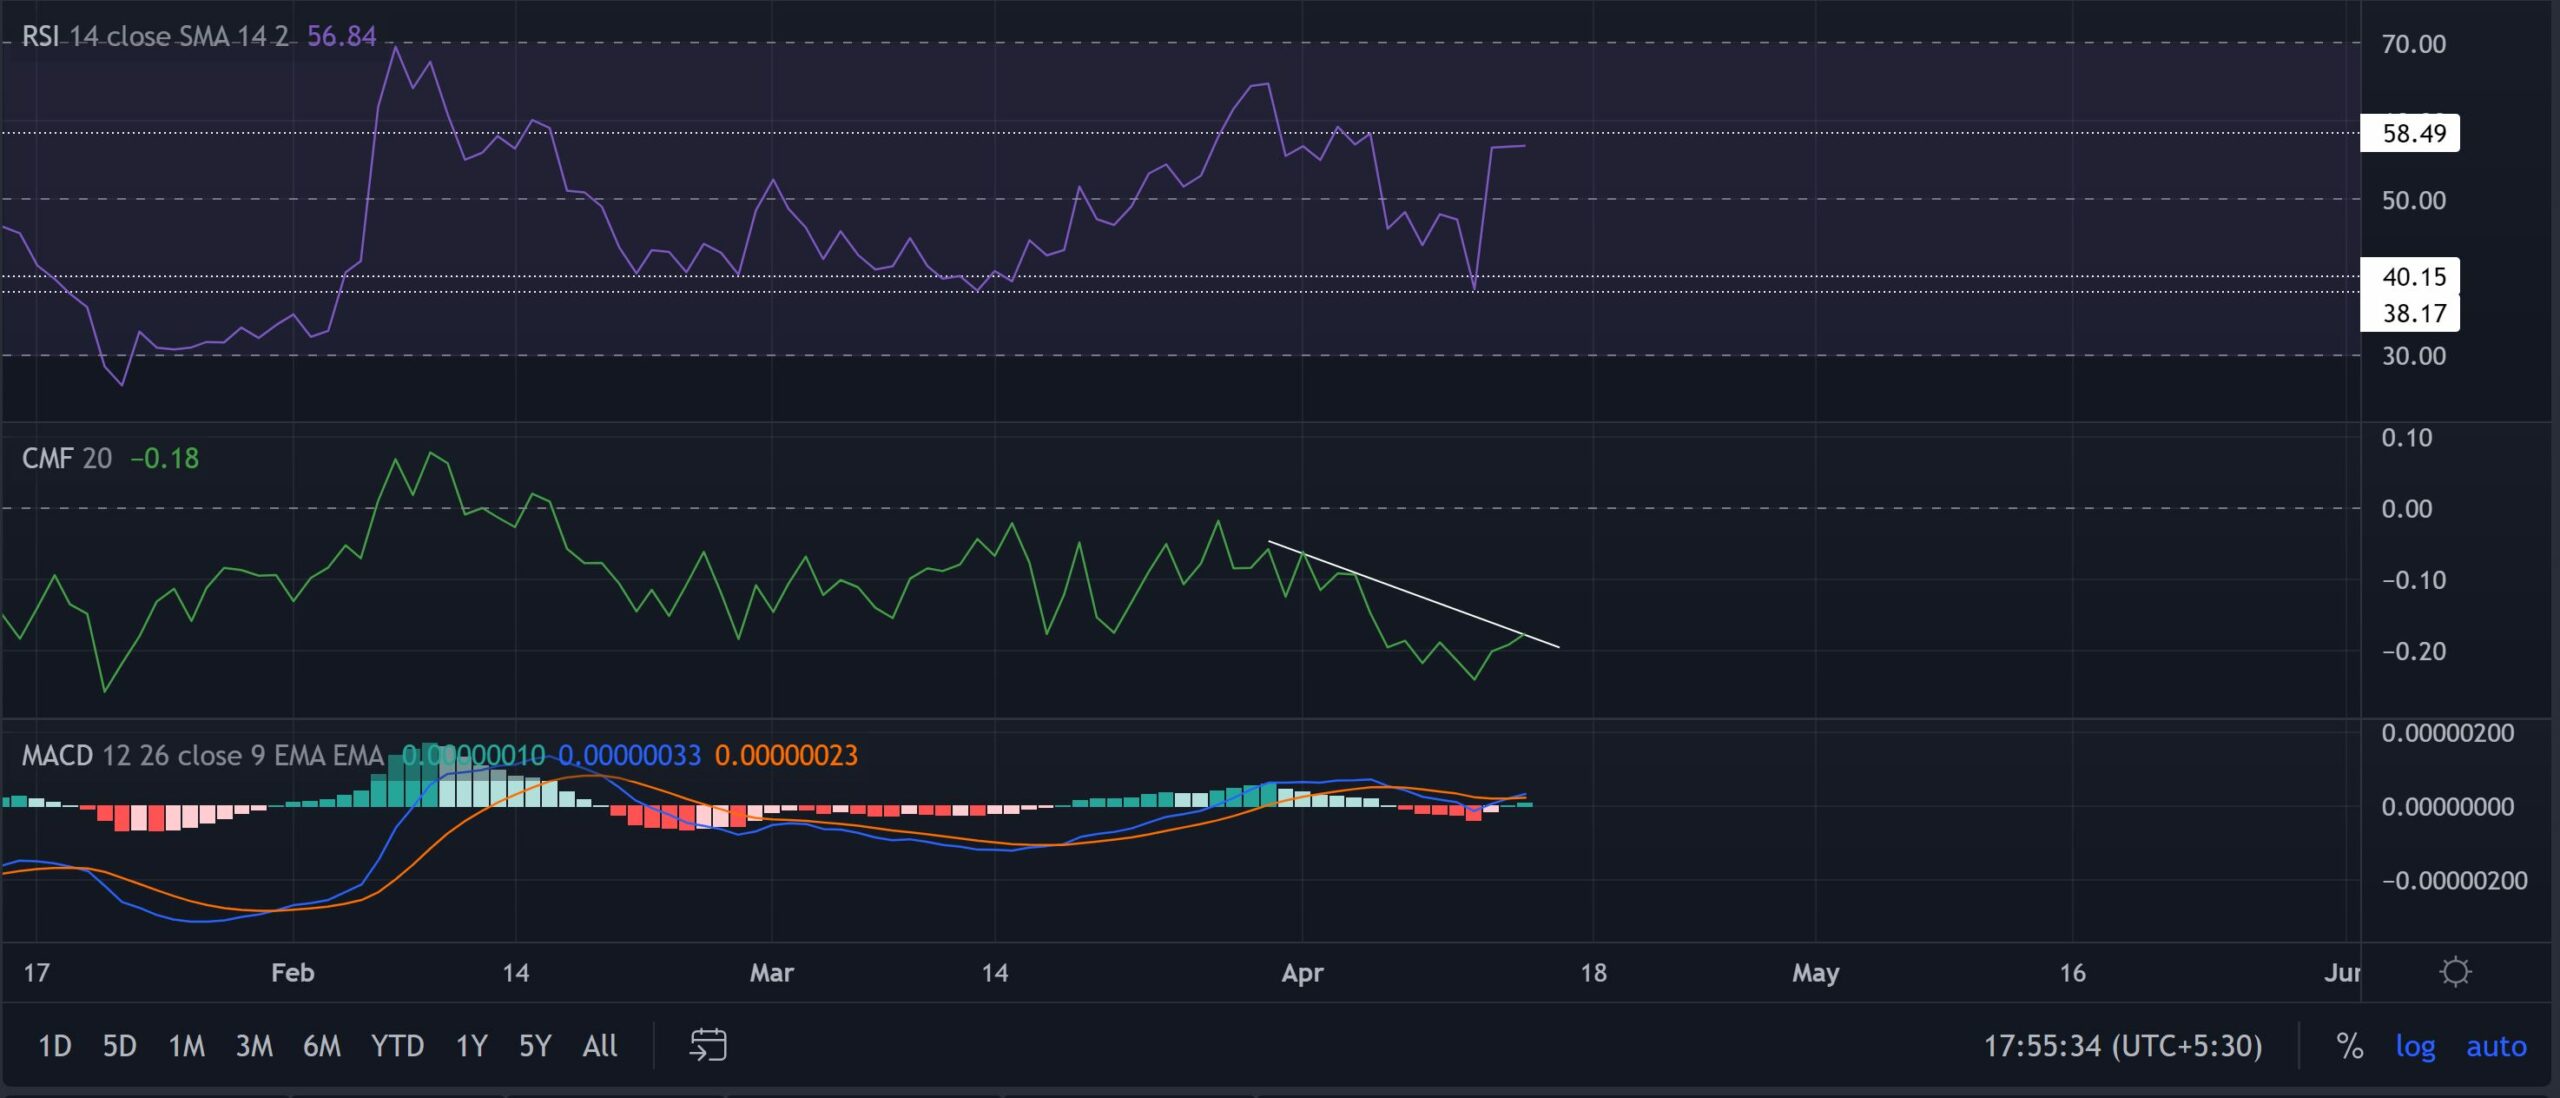
The RSI has been on a slight downslide since facing resistance at the 58-mark. A possible close below this mark would hinder the alt’s current upswing.
Further, the CMF was well below the zero-line and confirmed a selling advantage. Any reversal from its immediate trendline resistance could trigger a bearish divergence with price. In which case, SHIB could witness a pullback phase due to decreasing money volumes.
Contrarily, the MACD lines undertook a bullish crossover while its histogram swayed above the zero-line. Thus, revealing an increasing buying influence.
Conclusion
Should the current trendline resistance (white trendline) stand sturdy, any fall below the POC would brace the alt for a 20 EMA retest before a continued effort on the part of buyers to keep inflating the price.
Moreover, the alt shares a nearly 67% 30-day correlation with Bitcoin. Hence, keeping an eye on Bitcoin’s movement with the overall market sentiment could be essential for making a profitable move.


