Why Solana bulls might succeed in driving a near-term rally from $20

Disclaimer: The information presented does not constitute financial, investment, trading, or other types of advice and is solely the writer’s opinion.
- The structure remained strongly bearish.
- Solana buyers will have the advantage of a clear invalidation.
Solana faced some negative sentiment in March after the outages in late February, but the network could be on the way to recovery already.
The on-chain metrics noted a large uptick in active users, and the bearish sentiment began to weaken as well based on data from Santiment.
Read Solana’s [SOL] Price Prediction 2023-24
On the price charts, SOL traded at a strong demand zone at press time. Bulls could see a favorable risk-to-reward buying opportunity in the coming days.
The range lows were retested once more, but $21.5 remained a stubborn resistance level
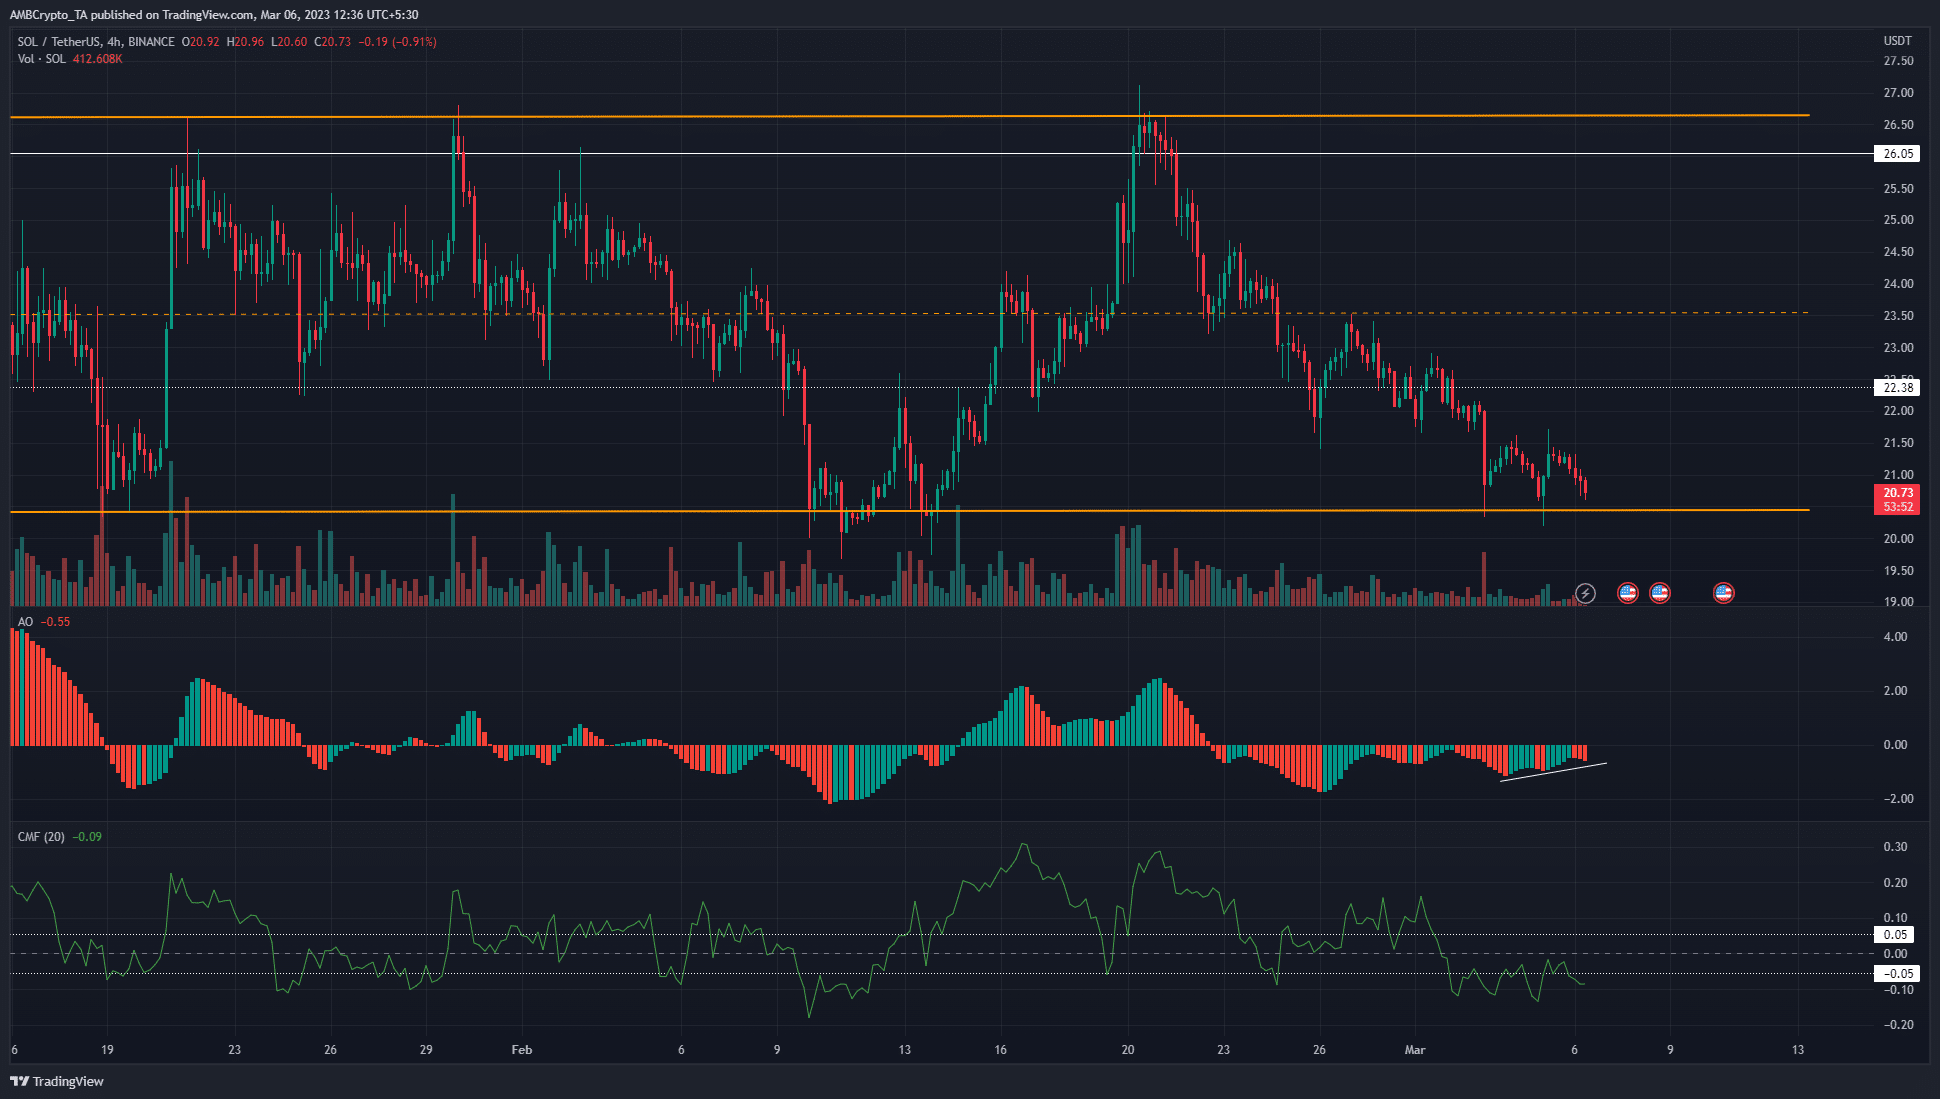
Solana has traded within a range since mid-January. This range extended from $20.5 to $26.7, and its mid-point sat at $23.55. At the time of writing the token was perched near the lows of the range.
The trading volume began to decline post 20 February after SOL faced rejection at the $26.7 range highs. In recent days the volume was low. The CMF hovered just below -0.05 and showed that capital flow out of the market remained significant.
Therefore, Solana bulls must carefully manage risk when buying the asset. More risk-averse traders can wait for a move above $21.5 and a bullish break in the lower timeframe market structure such as H1 before buying.
How much are 1, 10, and 100 SOL worth today?
Invalidation of this bullish idea would be a daily session close below $20.5. However, the likelihood of further losses was not great.
The Awesome Oscillator showed weakening bearish momentum even though SOL formed lower lows on 3 and 4 March. Meanwhile, Bitcoin also traded above a significant demand zone at $21.6k.
The spot CVD highlighted selling pressure remained dominant
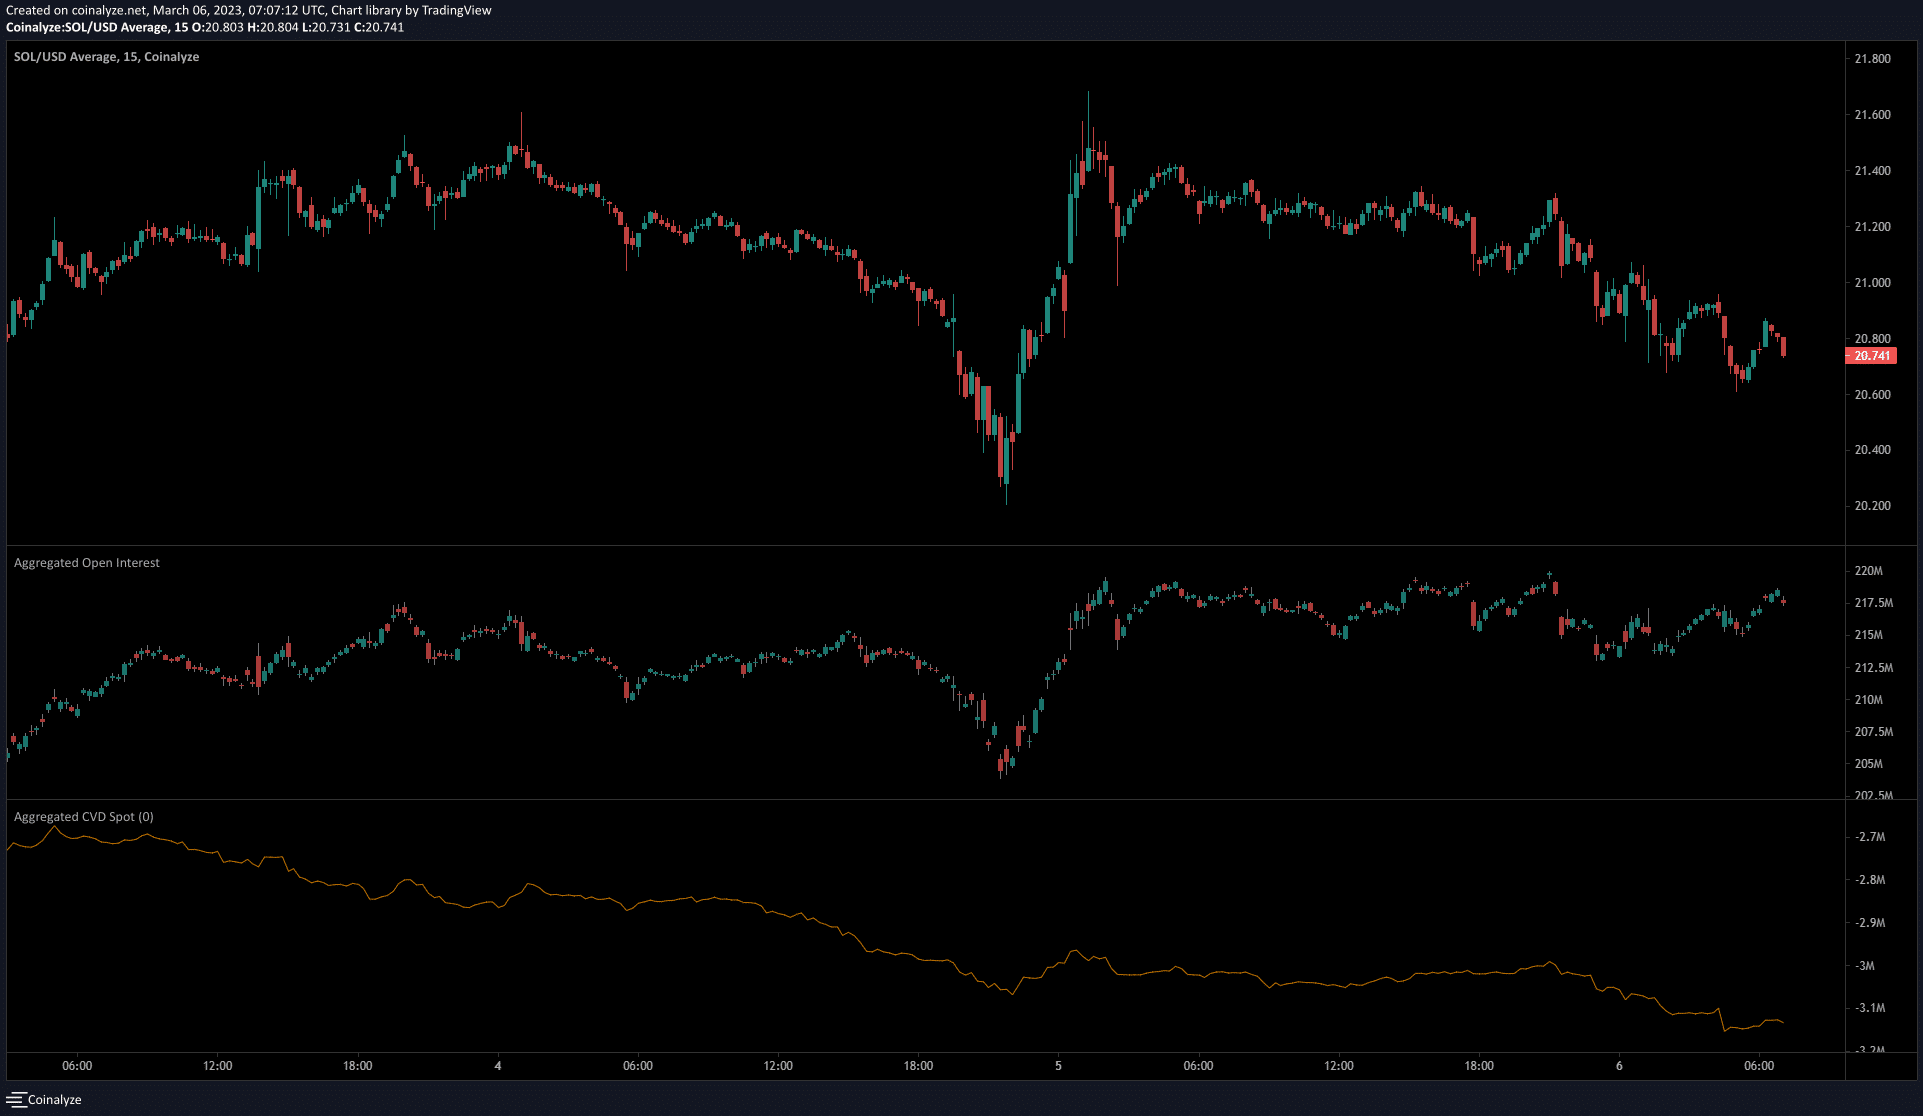
The momentum indicators showed bears were in decline, but the spot CVD showed sellers remained alarmingly dominant. The steady decline in the metric highlighted persistent selling pressure.
The Open Interest also remained flat on 5 March, although SOL registered some losses. This showed that market participants were likely shorting the token, which denoted strong bearish sentiment on the lower timeframes.
Therefore, more risk-averse buyers can wait for these conditions to shift in bullish favor before looking to buy SOL.