Why Solana [SOL] traders should wait for a bounce into the $21 area
![Why Solana [SOL] traders should wait for a bounce into the $21 area](https://ambcrypto.com/wp-content/uploads/2023/03/PP-2-SOL-cover-e1678360919255.jpeg)
Disclaimer: The information presented does not constitute financial, investment, trading, or other types of advice and is solely the writer’s opinion
- The breakdown beneath $20 meant imbalances on the daily chart to the south could be tested soon.
- The lower timeframe bias of Solana was also strongly bearish.
Solana presented a worrying possibility on the price charts. Its performance in January was remarkable, but its sharp fall beneath the psychological $20 level meant bears were utterly dominant. Bitcoin’s price chart did not inspire bullish confidence either.
Read Solana’s [SOL] Price Prediction 2023-24
The next levels of support lie around $17.7 and $15. These are significant levels where the bulls could mount a comeback, but it was likely that a retracement as far as $12-$14 was on the cars.
Could Solana retrace all the gains made in January?
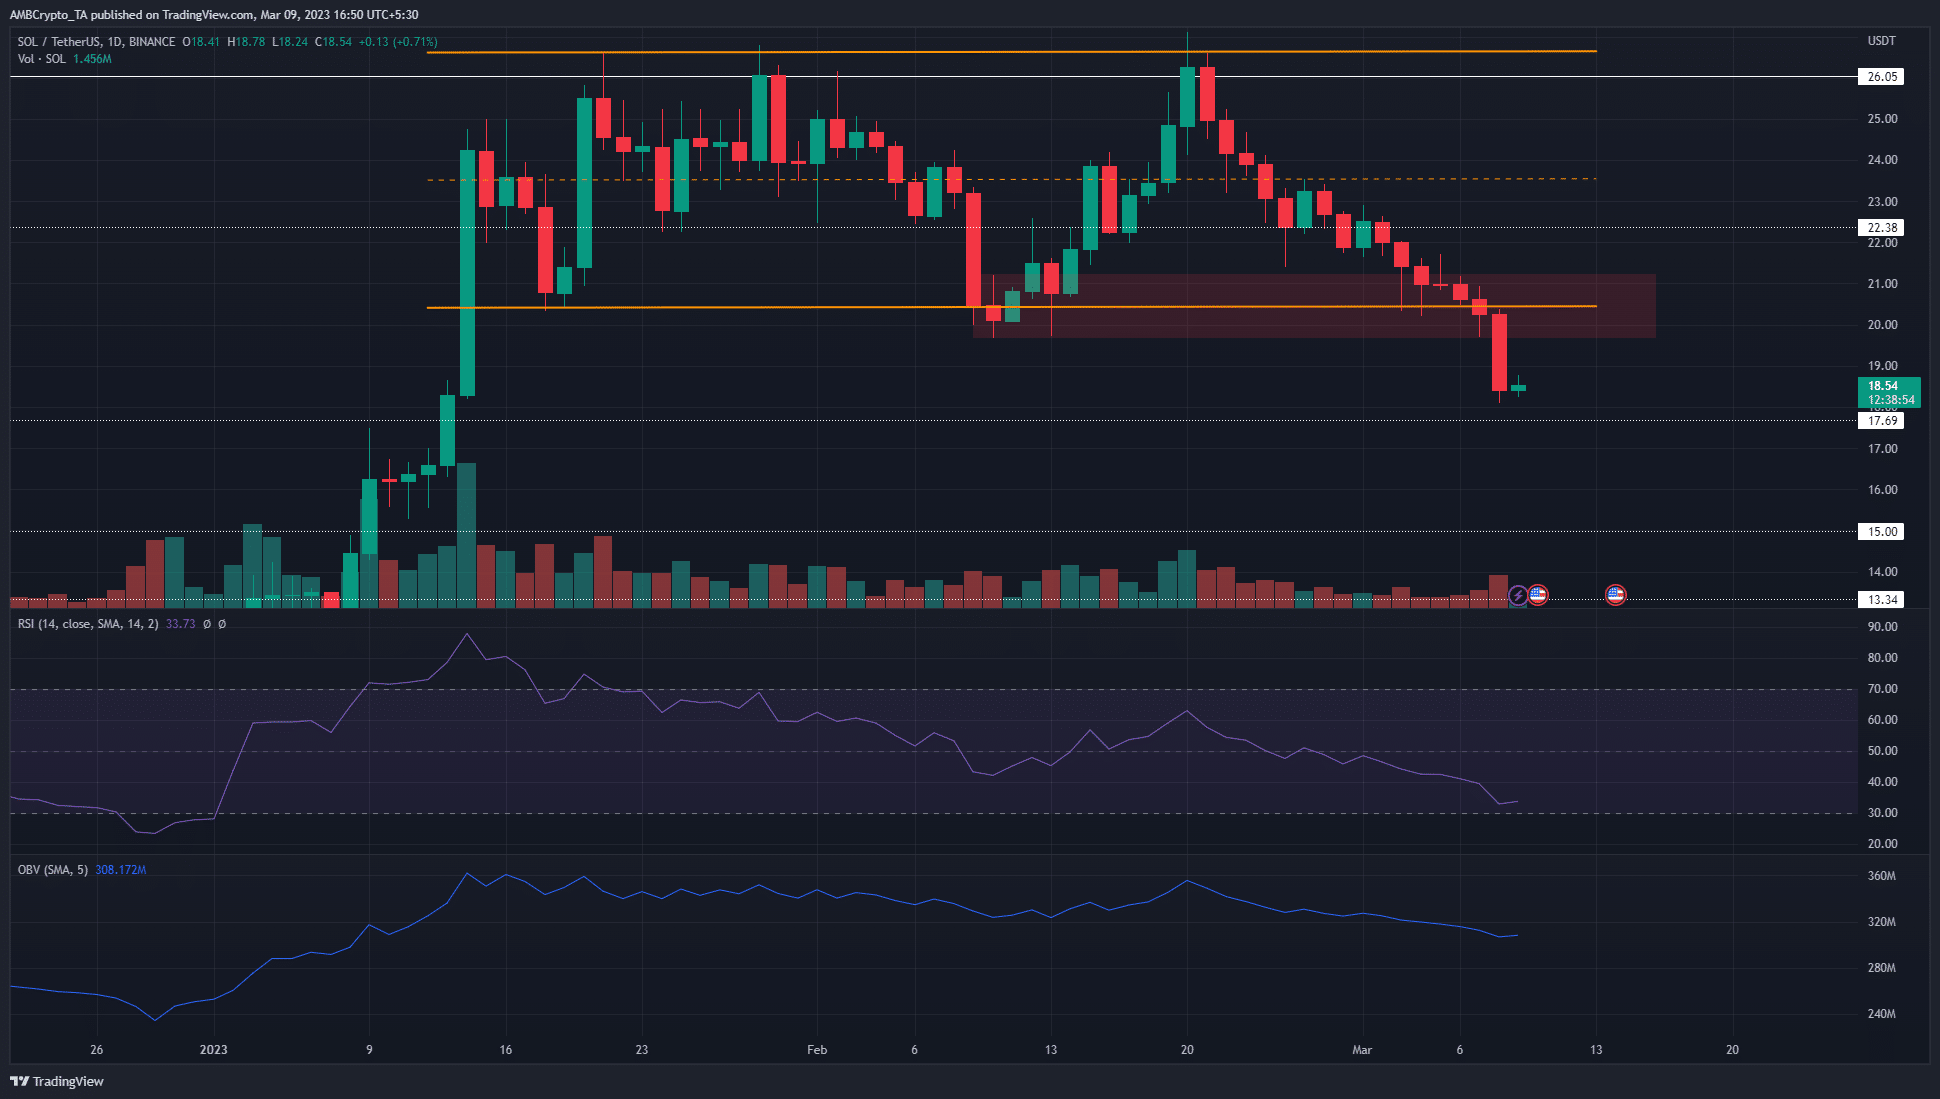
The range that Solana traded within from mid-January until recently extended from $20.45 to $26.05, and the mid-range mark lay at $23.55. In the past few days, selling pressure forced SOL to fall beneath the $22.5 level of support and toward $20.
The bears succeeded in breaching the range lows as well. Moreover, they managed to punch through the support area swiftly and overwhelmed the buyers. The drop from $20.45 saw an imbalance left on the charts, although the daily session was not yet closed at press time.
This fair value gap extended up to $19.74, and hence it could get filled in the coming days. Furthermore, the daily bearish breaker block highlighted in red was also likely to be retested.
Previously this region had been a bullish order block, which had confluence with a six-week long range.
Realistic or not, here’s SOL’s market cap in BTC’s terms
Therefore, any retests of the $20-$21 area will likely offer short sellers an opportunity to enter the market, with invalidation above $21.7. The RSI has been below neutral 50 for more than a week and agreed with the bearish bias, and the OBV was in a slow decline over the past two weeks as well.
Long positions saw large liquidations following the drop beneath $20
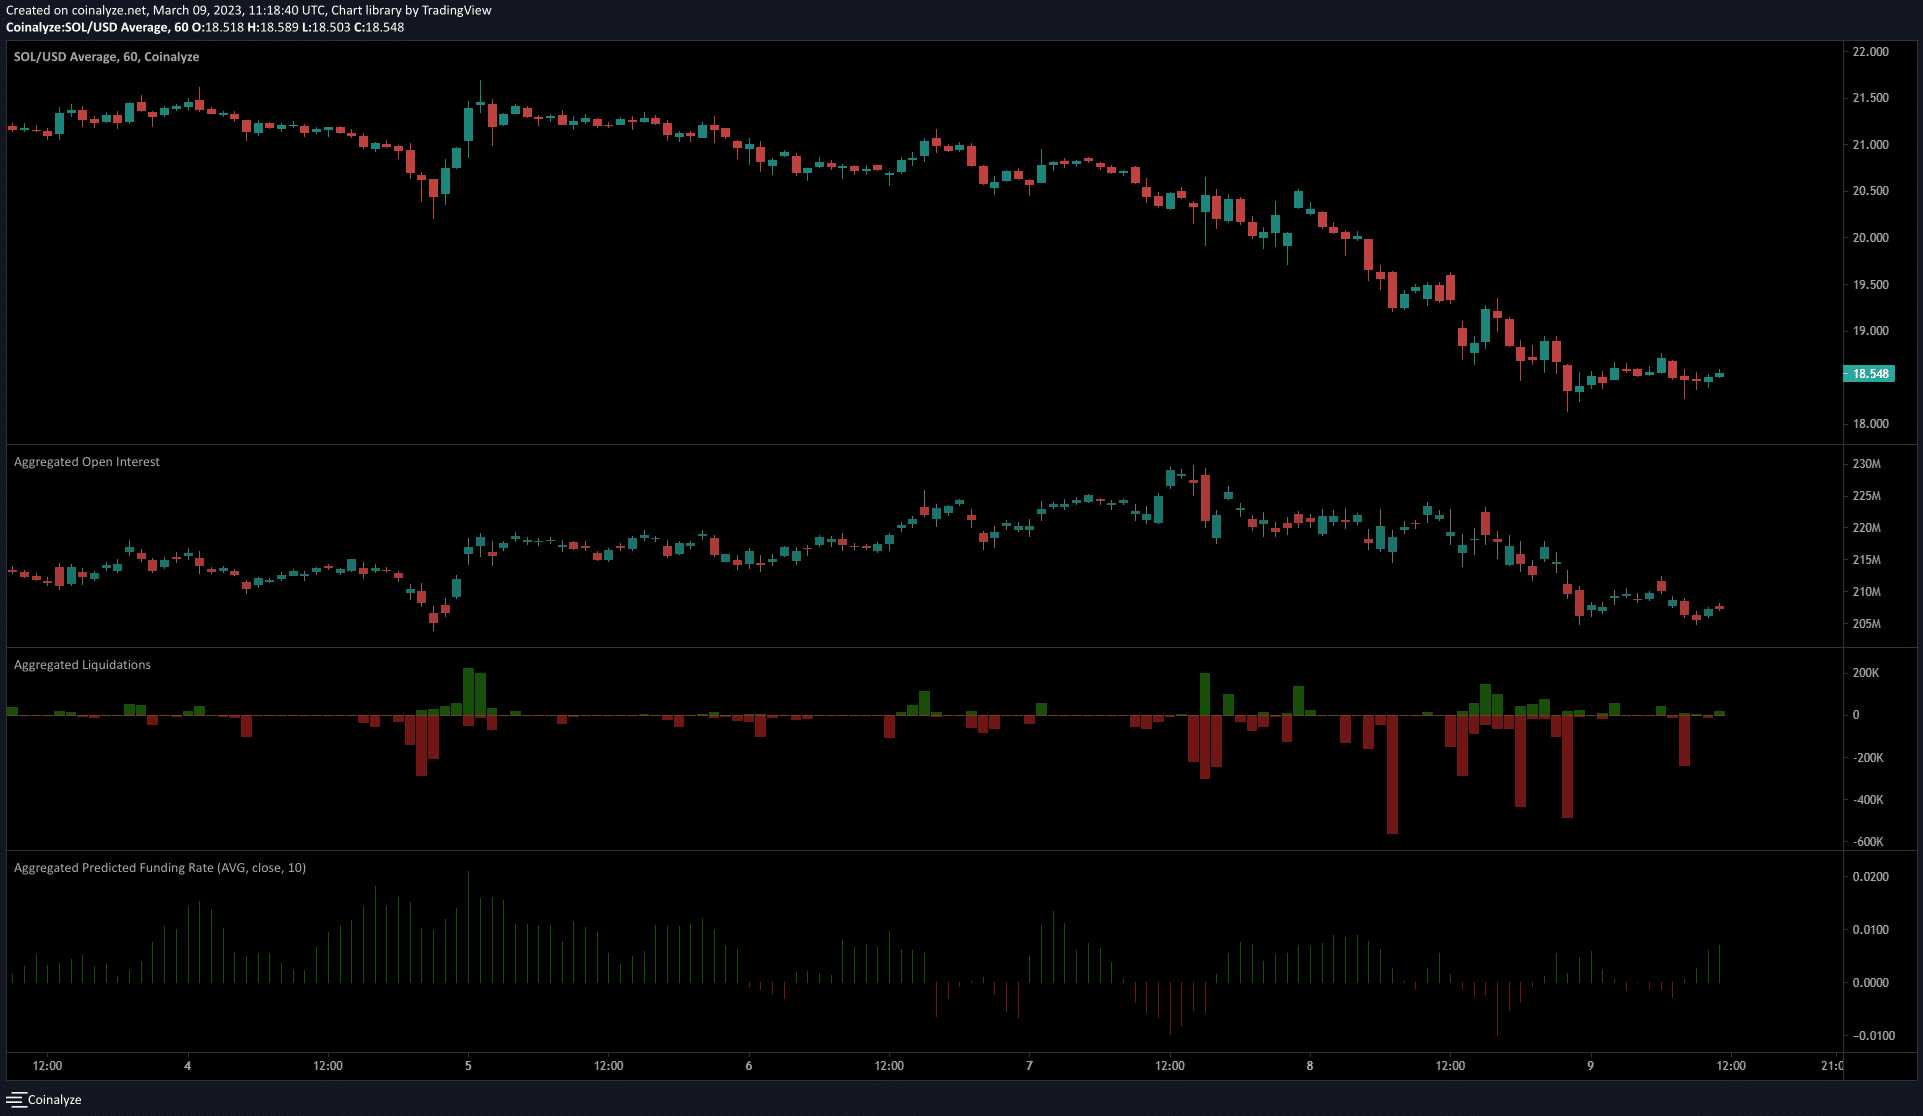
The 15-minute chart showed falling prices and Open Interest over the past couple of days. This hinted at continued bearish sentiment and discouraged long positions. The drop below $20.5 support saw long positions liquidated in large quantities.
On 8 March, there were three individual 15-minute sessions that saw long positions worth more than $400k liquidated. This further fueled the selling pressure behind Solana, while the funding rate dipped into negative territory when the prices plunged.


