Bitcoin’s price is currently $56225 based on data from CoinMarketCap. The price is rangebound yet again below $60000 and this has increased trade activity in the altcoin market, with altcoins that were less popular before Q1 of 2021 saw a boost in interest. Band Protocol, based on the latest price data from Santiment is up 13% against Bitcoin’s price in the past 24 hours, and the trade volume is growing consistently. The 24-hour trade volume is up 183% and this is unlike most other altcoins currently.
The quantity of BAND held by whales (HODLing more than $1.4 Million) since early February 2021 has increased consistently. The current increased activity is considered to be the whale’s inverse reflection against HODLers in the mid-tier, and this has impacted the HODLing pattern and distribution of BAND.
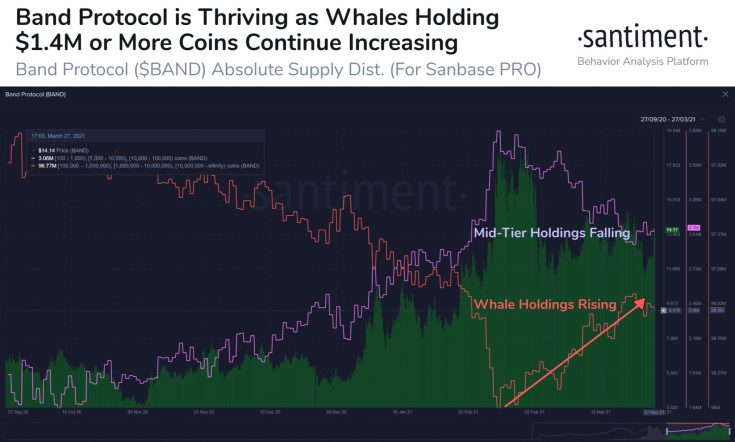
BAND Whale activity || Source: Twitter
Based on the above chart, the mid-tier holdings are dropping consistently, and BAND whales are buying, with the coin’s concentration by large HODLers hitting a record 97%. Another effective metric for tracking the price trends of altcoins like ENJ, MANA, STORJ, and MATIC is the deposits vs. non-deposit activity model. Based on data from Santiment, currently, most altcoins have an increasing ratio of non-deposits vs. deposits. Many altcoins, not for the same reasons, are surging against Bitcoin.
There has been an unanticipated increase in volume, with three-digit and two-digit gains the past week and the past 24 hours. This is an alt rally, as the charts suggest, however, altcoins that didn’t register growth in Q4 of 2020, have witnessed it in 2021. It is worth keeping an eye on ENJ, MANA, STORJ, and MATIC based on the following chart.
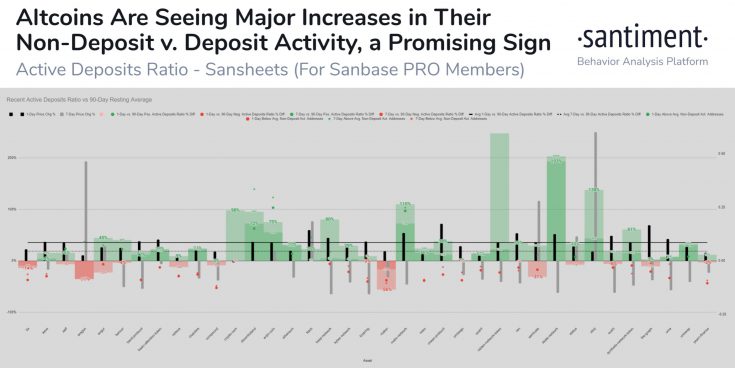
Deposit vs Non-deposit Activity for altcoins || Source: Twitter
Based on the above chart, the 7 days vs the 90 days active deposit ratio has increased by over 50% for nearly all altcoins on the chart, and over 100% for a handful. This suggests that there is a peak in interest and investment inflow from both institutional traders and retail.
Investments are directed towards altcoins with low market capitalization, without concerns for liquidity and volatility, thus boosting trade volume on spot exchanges. It is critical to take note of changing trader activity as this could be the precursor to a bigger shift in trend, moving on from Bitcoin and range-bound price action to portfolio-focused double-digit growth. Since the launch of Grayscale’s altcoin funds, there is increased interest and traders are anticipating that most of the altcoins that emerged this quarter may soon see leverage trading on spot exchanges, further boosting the trend and conforming to the extended altcoin rally this season.