


2021 has been an action-packed year for Graph token. The current 51st largest crypto by capitalization, begun its northward journey in the mid-of January earlier this year. At that point in time, its price was hovering around the $0.2 mark.
The next couple of weeks were quite lively, and by 12 February, this token created created its $2.8 high. Since then, however, things have been quite pessimistic on its price chart. At the time of writing, this token was almost back to square one and was seen exchanging hands around $0.6.

Even though GRT has seen more lows than ups of late, it has been able to make its presence felt in the space. Investors today are paying more attention to the developer tangent associated with protocols and Graph’s performance on this front has been noteworthy. Now, it is a known fact that Graph is an indexing protocol that queries data for networks like Ethereum.
To break things down further, consider this – Ethereum’s blockchain has one of the most diverse sets of data belonging to various projects and side networks built on top of its parent chain. With Graph’s indexing protocol, developers can pretty easily search for any dataset through simple queries.
Going forward, such open-source indexing protocols would bring out chain reorganization alongside query fulfillment and thereby, improve the application experience of DeFi apps. The network has already powered a host of applications on DeFi. At this juncture, Graph is one of the most reliable protocol brining decentralized public infrastructure to the mainstream market.
The fundamental positives
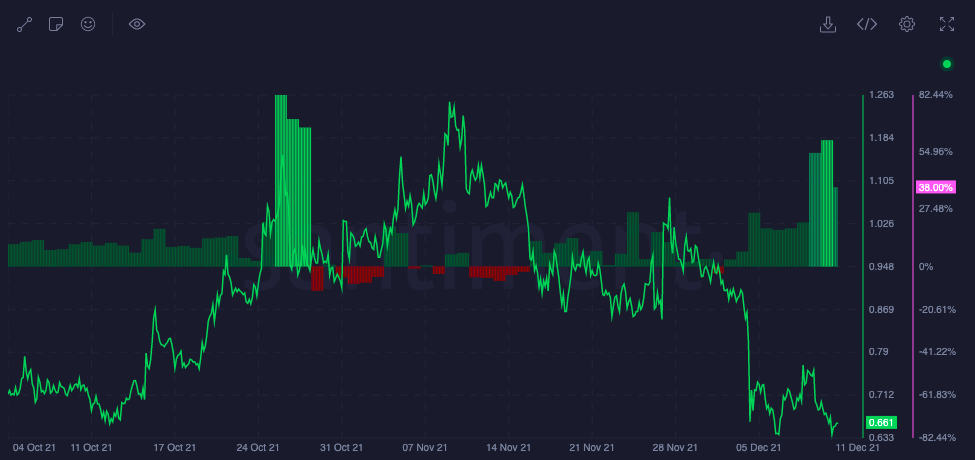
Despite the not-so-healthy price trends, the network-related activity, alongside its utility and use-cases, has been quite imposing. Consider its Price DAA divergence, for starters. Bullish streaks have been dominating the chart of this metric since the beginning of this month.
More often than not, such a divergence has allowed the asset to range better in the market and capture higher trading targets. The same was noted earlier in October and November this year.
So, if the bullish projections continue to surface on the chart, the underlying token’s price would likely start reacting to it positively.
Further, most of the HODLers continue to remain in the ecosystem. ITB’s data highlighted that the average HODLing period for this token is more than 8 months. This means that the token HODLer composition comprises of less traders and more of cruisers and investors.
In fact, the age metrics from Santiment also supported the aforementioned claim. The average age of the coin and the dollars invested have majorly been increasing of late. The same resonates to the larger accumulation phase going on. It also highlights investor confidence with respect to the token.
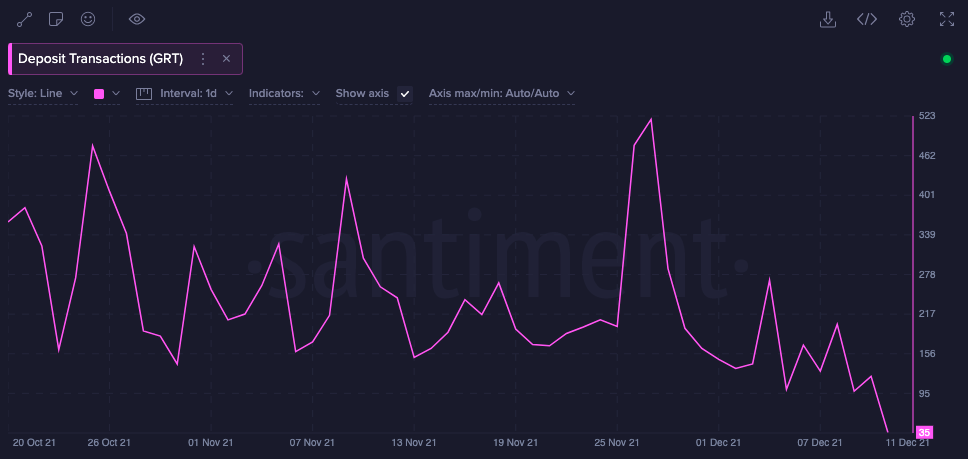
The deposit transactions too, for that matter, have been revolving more towards the downside since the beginning of this month. This metric, as such, shows the amount of all incoming and outgoing transactions involving GRT deposit addresses everyday. Spikes on the chart usually indicate a rise in short-term selling pressure.
However, keeping the current state of this metric in mind, it can be said that the majority of investors are calm and composed at this stage.
So, keeping the aforementioned positives in mind, it wouldn’t be wrong to claim that this token is good long-term bet and investors can consider adding this coin to their portfolios. Further, given the kind of service the Graph provides, the network is only set to gain more traction going forward.