Why WIF traders should prepare for a price crash in April
The growth in WIF’s demand may help sustain the rally, but technical indicators point towards a gloomy April for the memecoin.

- WIF’s price increased by over 30% in the past week.
- Its Chaikin Money Flow indicator shows that it may experience a price correction.
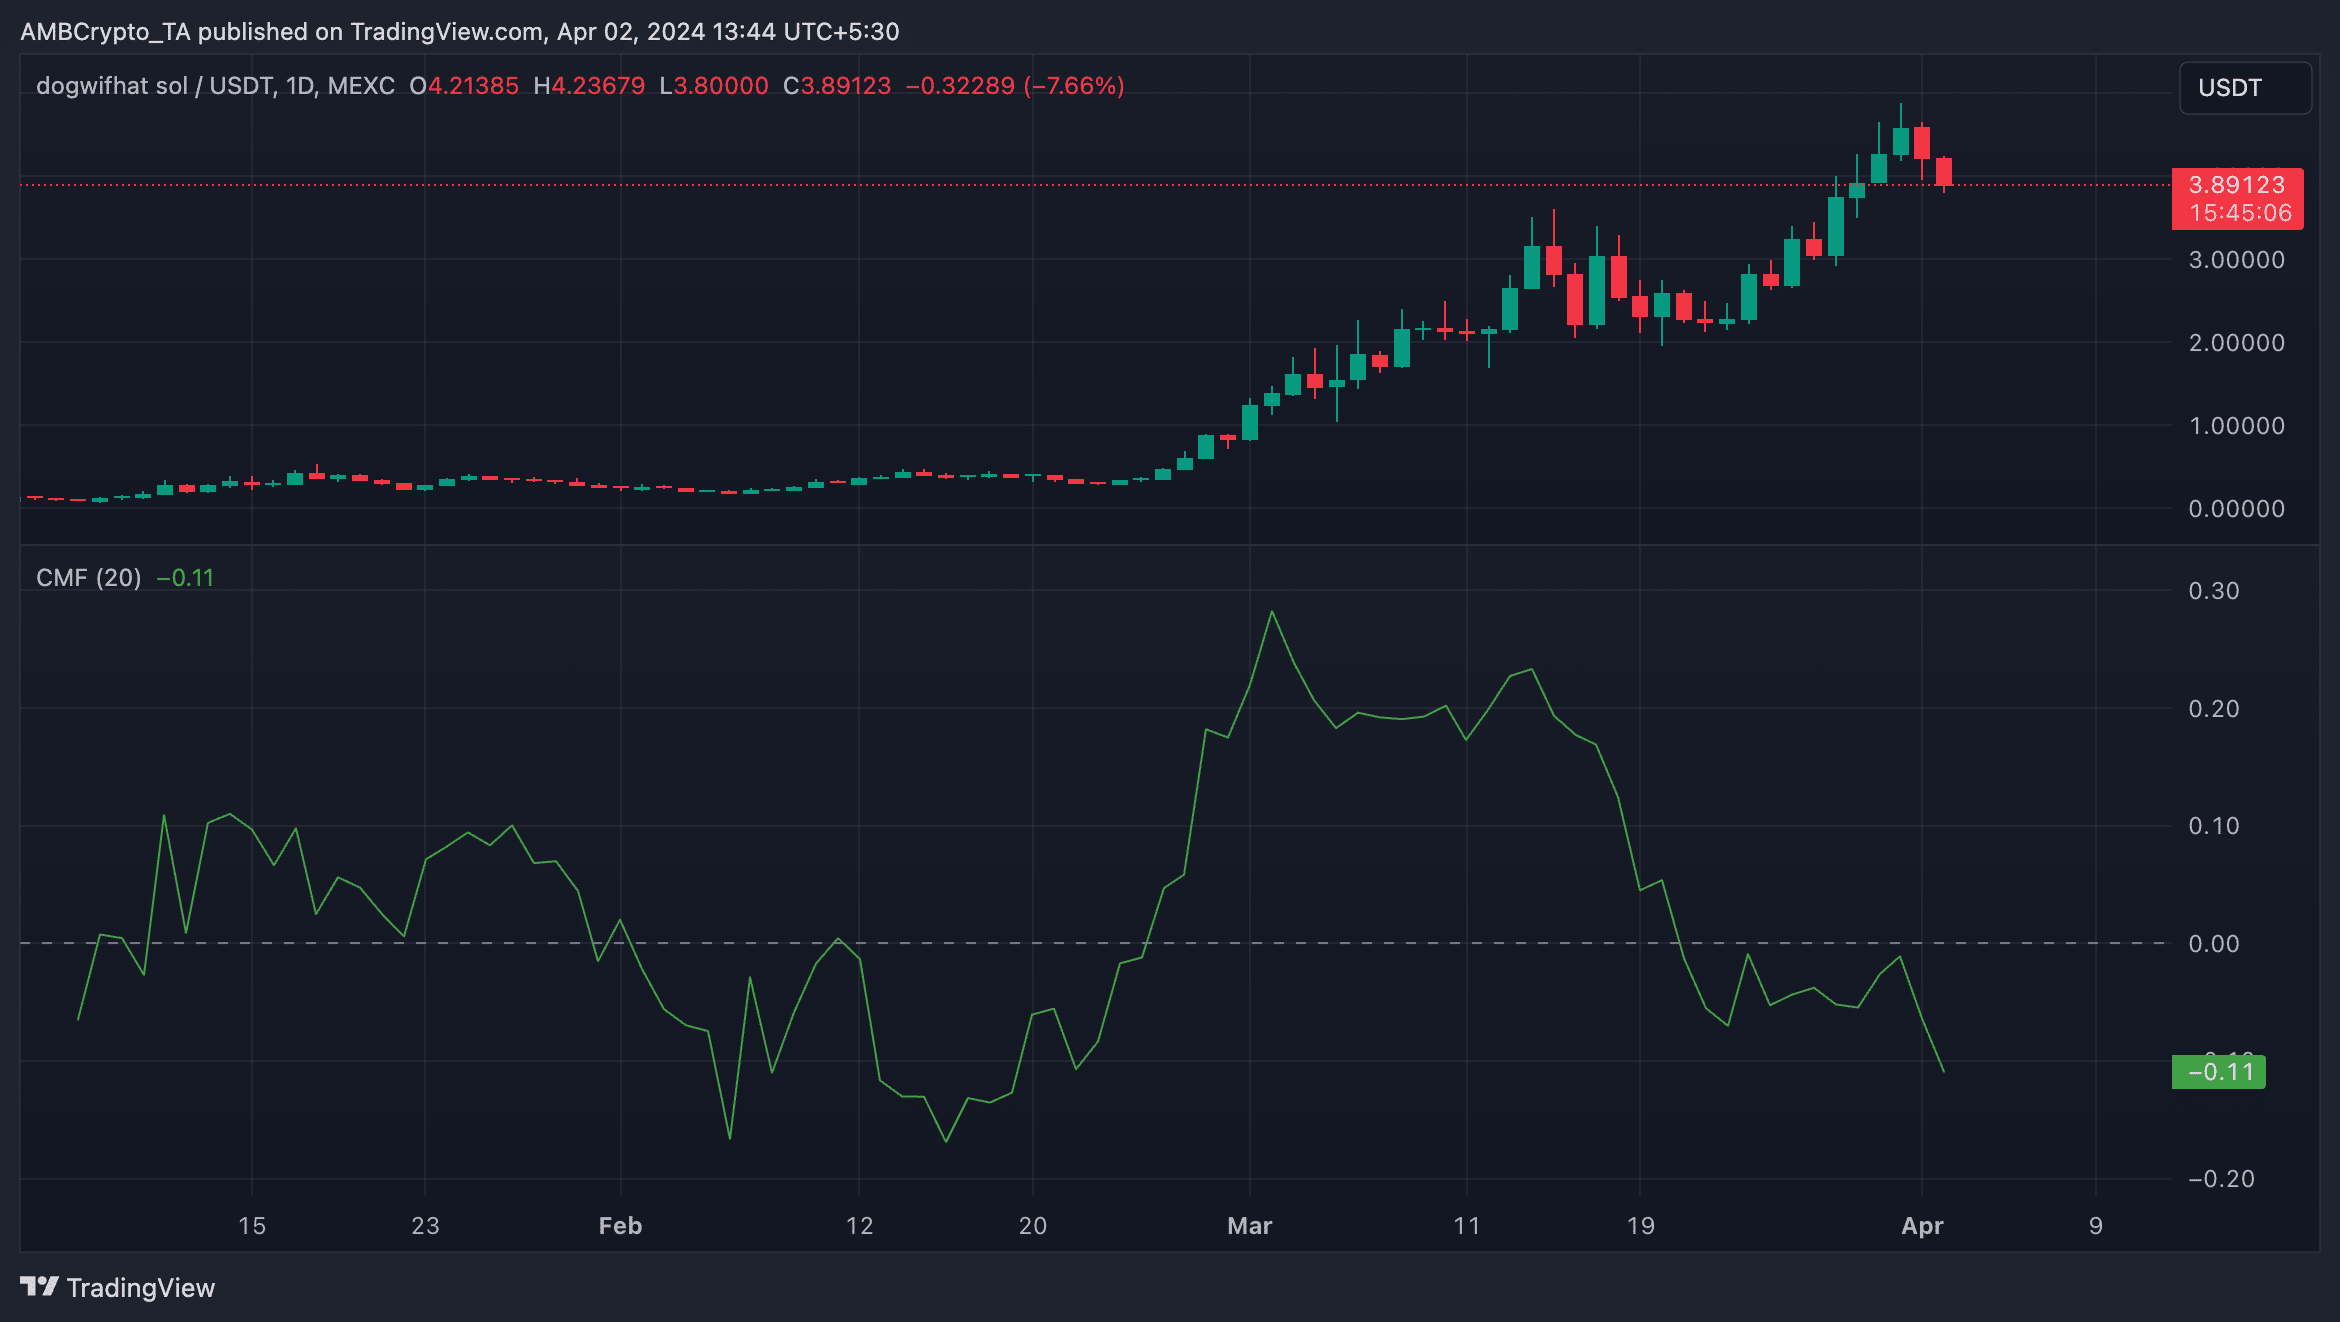
Solana-based meme coin dogwifhat [WIF] is poised to shed last week’s double-digit price as its Chaikin Money Flow (CMF) trends downward.
At press time, WIF traded at $3.88. Its price has risen by 32% in the last week, and it ranked as the crypto asset with the third-highest gains during that period, according to CoinMarketCap data.
However, the week has also been marked by a decline in WIF’s CMF. This indicator measures money flow into and out of an asset over a period of time.
When an asset’s price rises while its CMF trends in the opposite direction, a bearish divergence suggesting that the buying pressure may be weak is formed. Traders often interpret the divergence to be a sign of exiting long positions and taking short ones, as the trend is usually followed by a downward correction of an asset’s price.
Readings from WIF’s 1-day chart showed its CMF at -0.11 at press time. A CMF value below zero suggests a high volume of liquidity outflow and is a sign of weakness in the market.
Now may not be the time to worry
Despite the divergence between WIF’s price and its CMF indicator, its key momentum indicators showed that the current buying pressure may be enough to sustain the price rally in the short term.
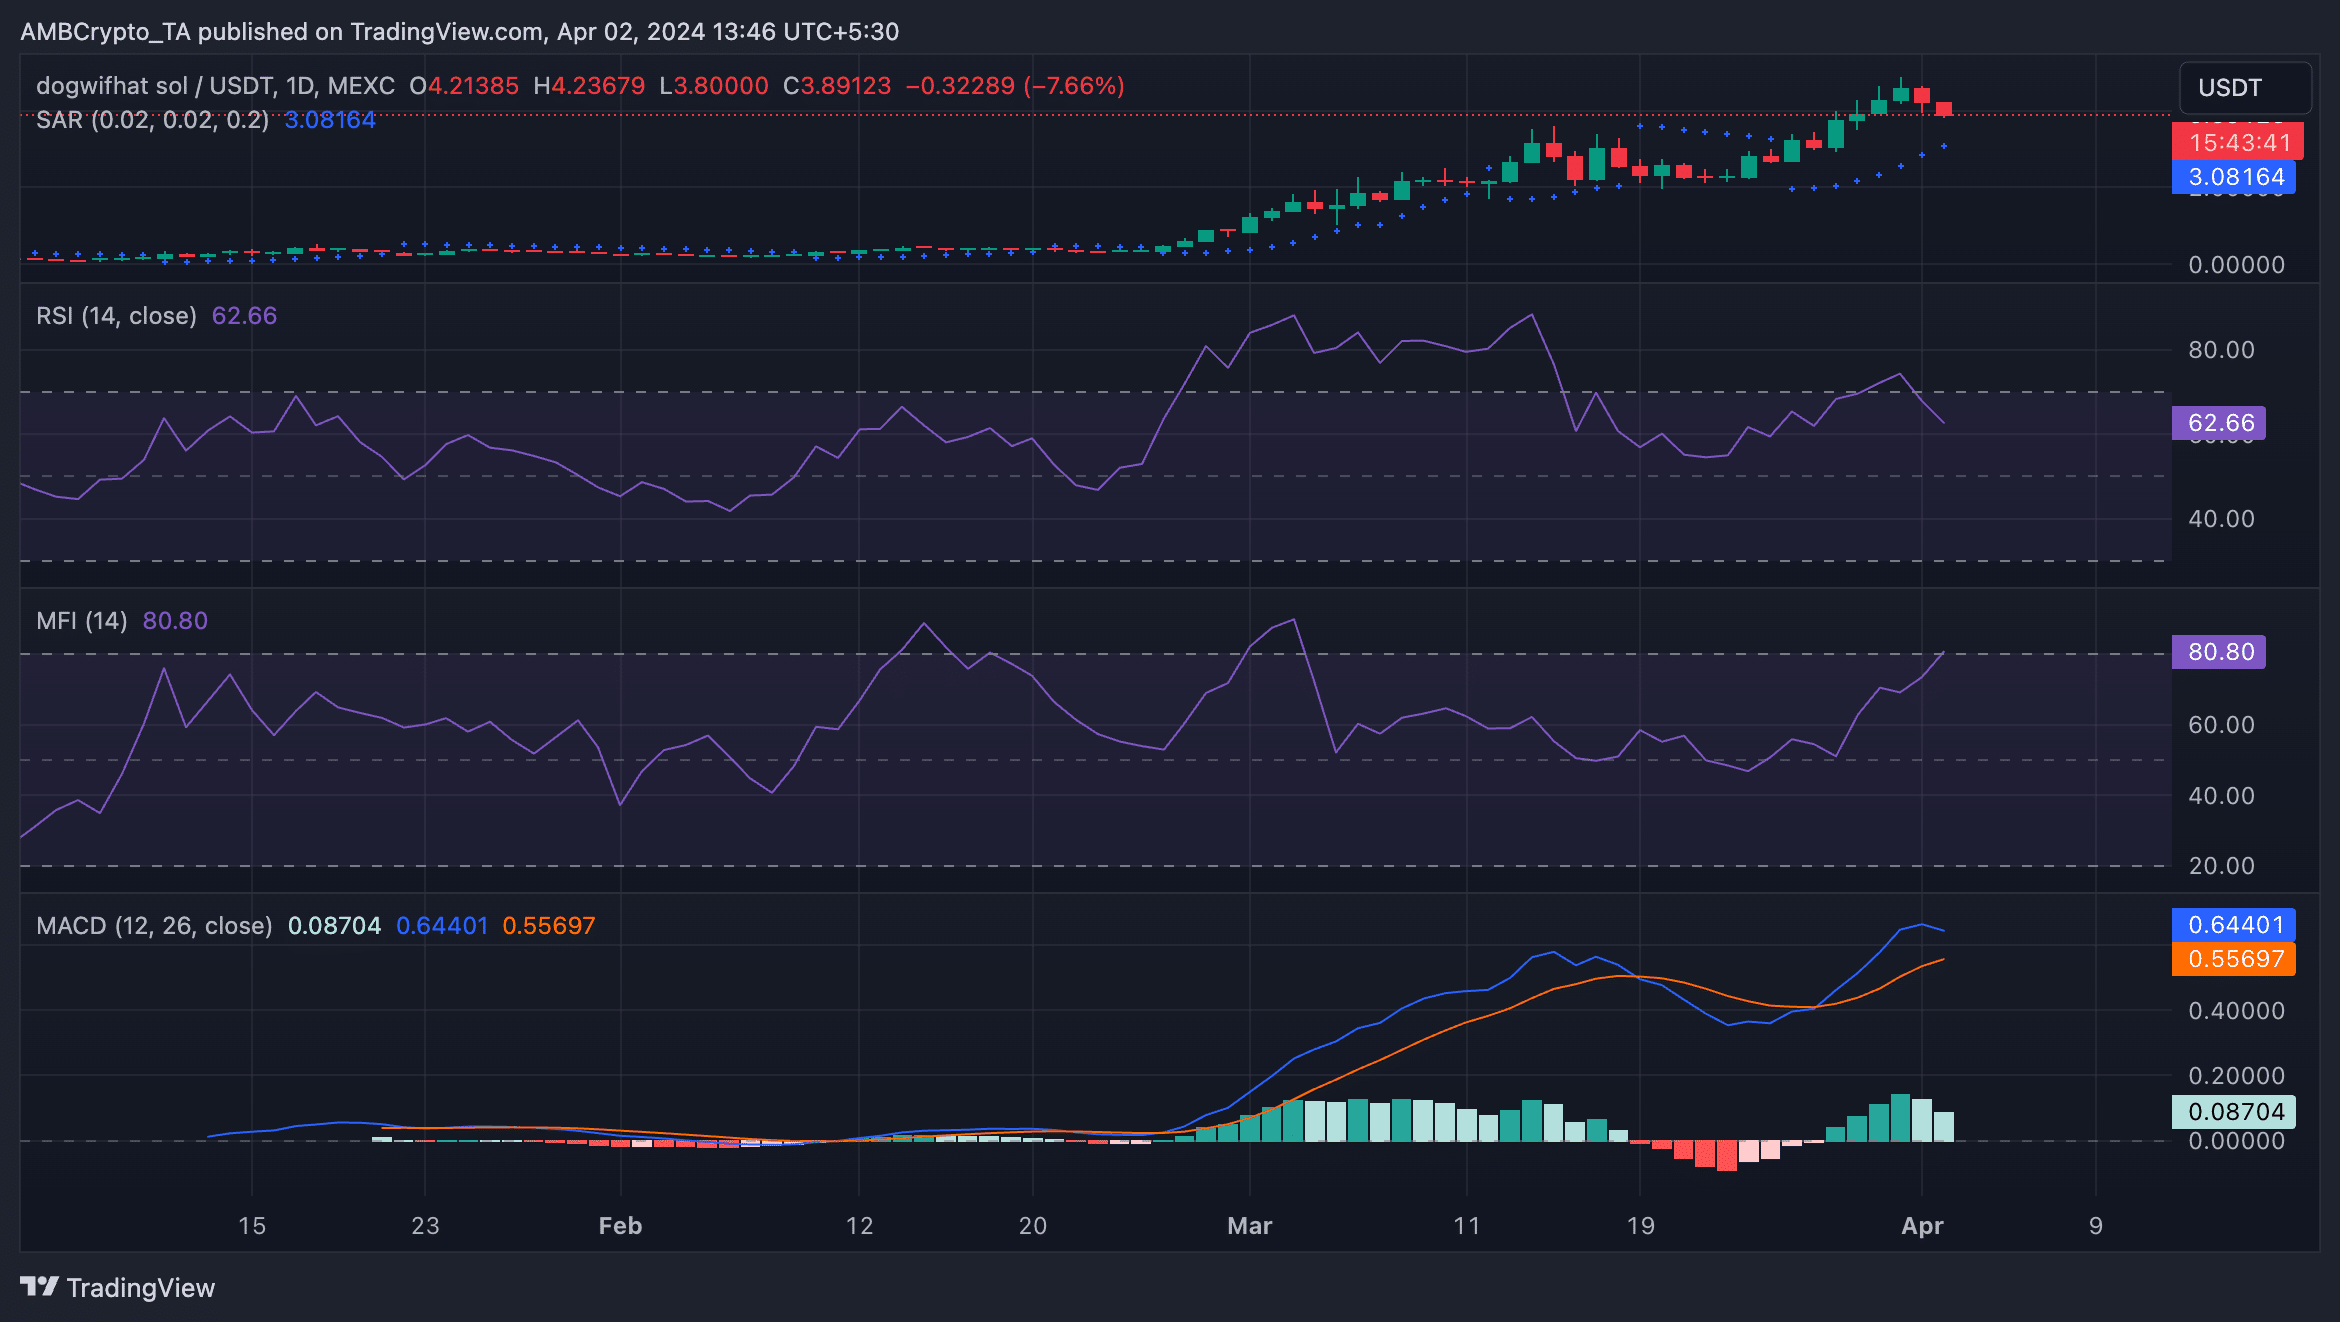
For example, the token’s Relative Strength Index (RSI) and Money Flow Index (MFI) were 62.66 and 80.80 as of this writing, respectively. This shows that WIF buying activity outpaced token sell-offs.
Confirming the current bullish trend, the token’s price rested above the dotted lines that make up its Parabolic SAR indicator. This indicator measures WIF’s trend directions and reversals. When its dotted lines are below the asset’s price, the trend is said to be bullish.
Realistic or not, here’s WIF’s market cap in BTC’s terms
Also, as of this writing, WIF’s MACD line was spotted above its signal line. These lines have been positioned this way since 27th March.
An upward intersection of an asset’s MACD line with its trend line suggests that the shorter-term moving average is moving away from the longer-term moving average, indicating bullish momentum in the short term.