Why XLM’s current accumulation phase presents a buying opportunity

Disclaimer: The findings of the following analysis are the sole opinions of the writer and should not be considered investment advice
Stellar Lumens formed a range after a downtrend from last November, but in recent weeks buying pressure suggested a reversal could occur. There was a range formation on the charts, which can be thought of as a rectangle bottom pattern.
XLM- 1 Day Chart
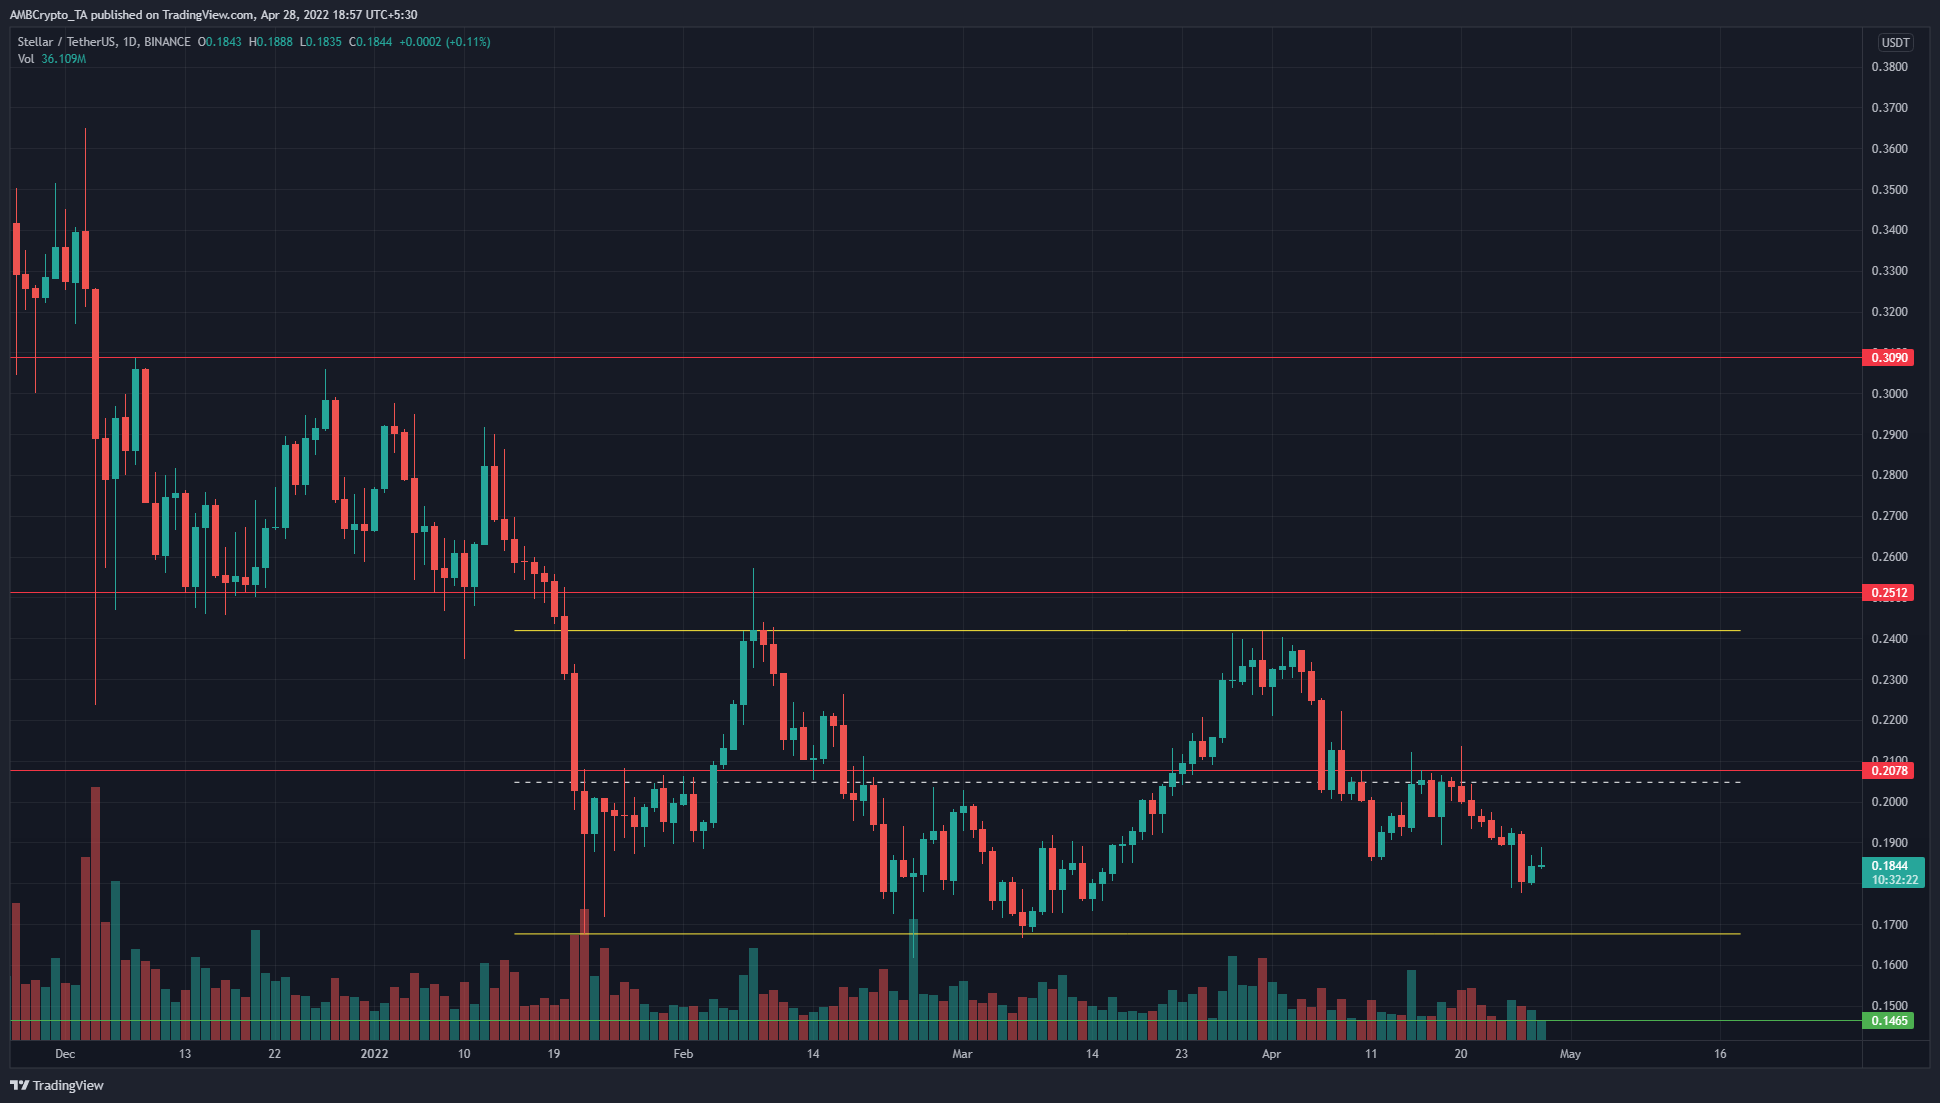
XLM formed a range between $0.24 and $0.167 since mid-January. In this same time period, Bitcoin has dropped to $35k but also appeared to have a bullish longer timeframe bias. However, XLM continued to have a bearish structure on the charts.
So what supports a rally in the weeks to come? There has been a lot of buying in recent weeks. Inside a range, when either the buying or the selling side is dominant according to volume bought/sold, it is generally indicative of the direction of the next move for the asset.
Therefore, the range lows near $0.17 can be a buying opportunity. On the other hand, if XLM is able to climb past $0.2, a retest of the same level as support could also be a buying opportunity.
Rationale
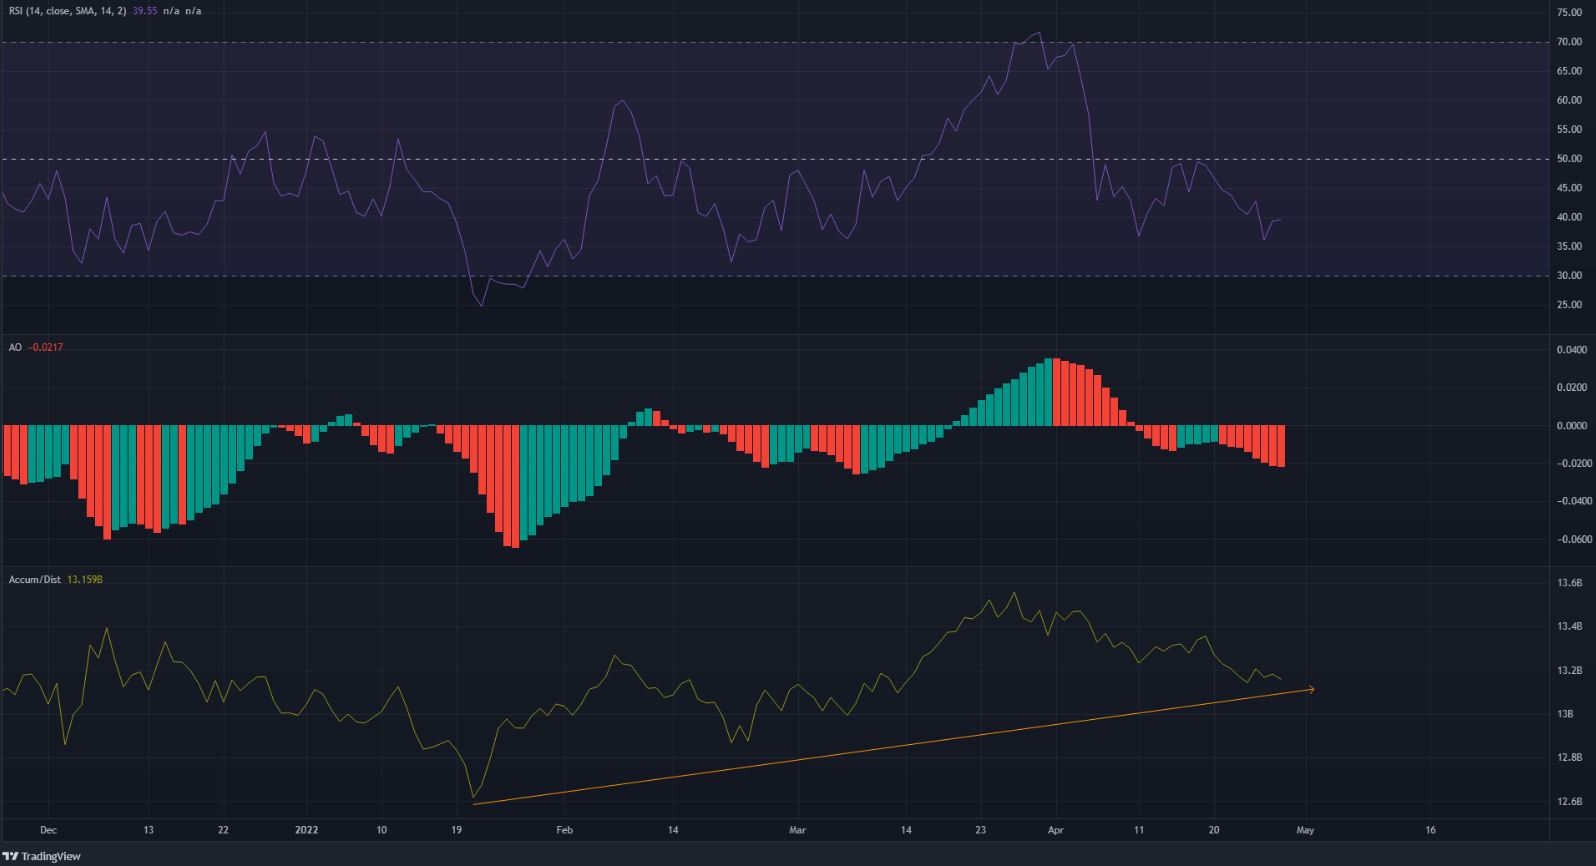
The RSI stayed below neutral 50 in the month of April to denote a bearish trend in progress. In the same time period, XLM has been unable to breach the mid-point of the range as well as the $0.2 resistance level. The Awesome Oscillator told a similar story, as it dropped beneath the zero line and showed bearish momentum held sway.
However, the A/D line has formed a series of higher lows since mid-January. This uptrend on the A/R indicator means that buying volume has outweighed selling volume in the past three months.
Conclusion
While the market structure remained bearish on longer timeframes, there was a range pattern within which Stellar Lumens was trading within. Moreover, there was some evidence to show that the coin was in a phase of accumulation. Therefore, long-term investors could look to load their bags in anticipation of a rally past the $0.24 range highs in the weeks to come.
Conversely, a daily session close below $0.163 could mean that bears have seized the initiative.


