Why XRP, MATIC are most likely to see a price correction now
The two coins are approaching key resistance levels, and when it happens their selling pressure will increase rapidly.

- The pullback in prices after token movement was weaker than a few months ago.
- The bullish sentiment in the market could see XRP, and MATIC break the weekly resistances.
Ripple [XRP] and Polygon [MATIC] have posted 16.35% and 8.7% gains in the past week respectively. However, they were also two of the top-15 crypto assets trading at key higher timeframe resistances.
Some altcoins in the top 15 such as Binance Coin [BNB] and Cardano [ADA] have managed to break past resistance levels stretching back to May 2022. What do the metrics say for XRP and MATIC’s attempts?
Long-term holder yardsticks showed intense movement
As prices approach key resistance levels, it is expected that selling pressure will increase rapidly. Token holders seeking to book profits would likely move their tokens to centralized exchanges to sell them.
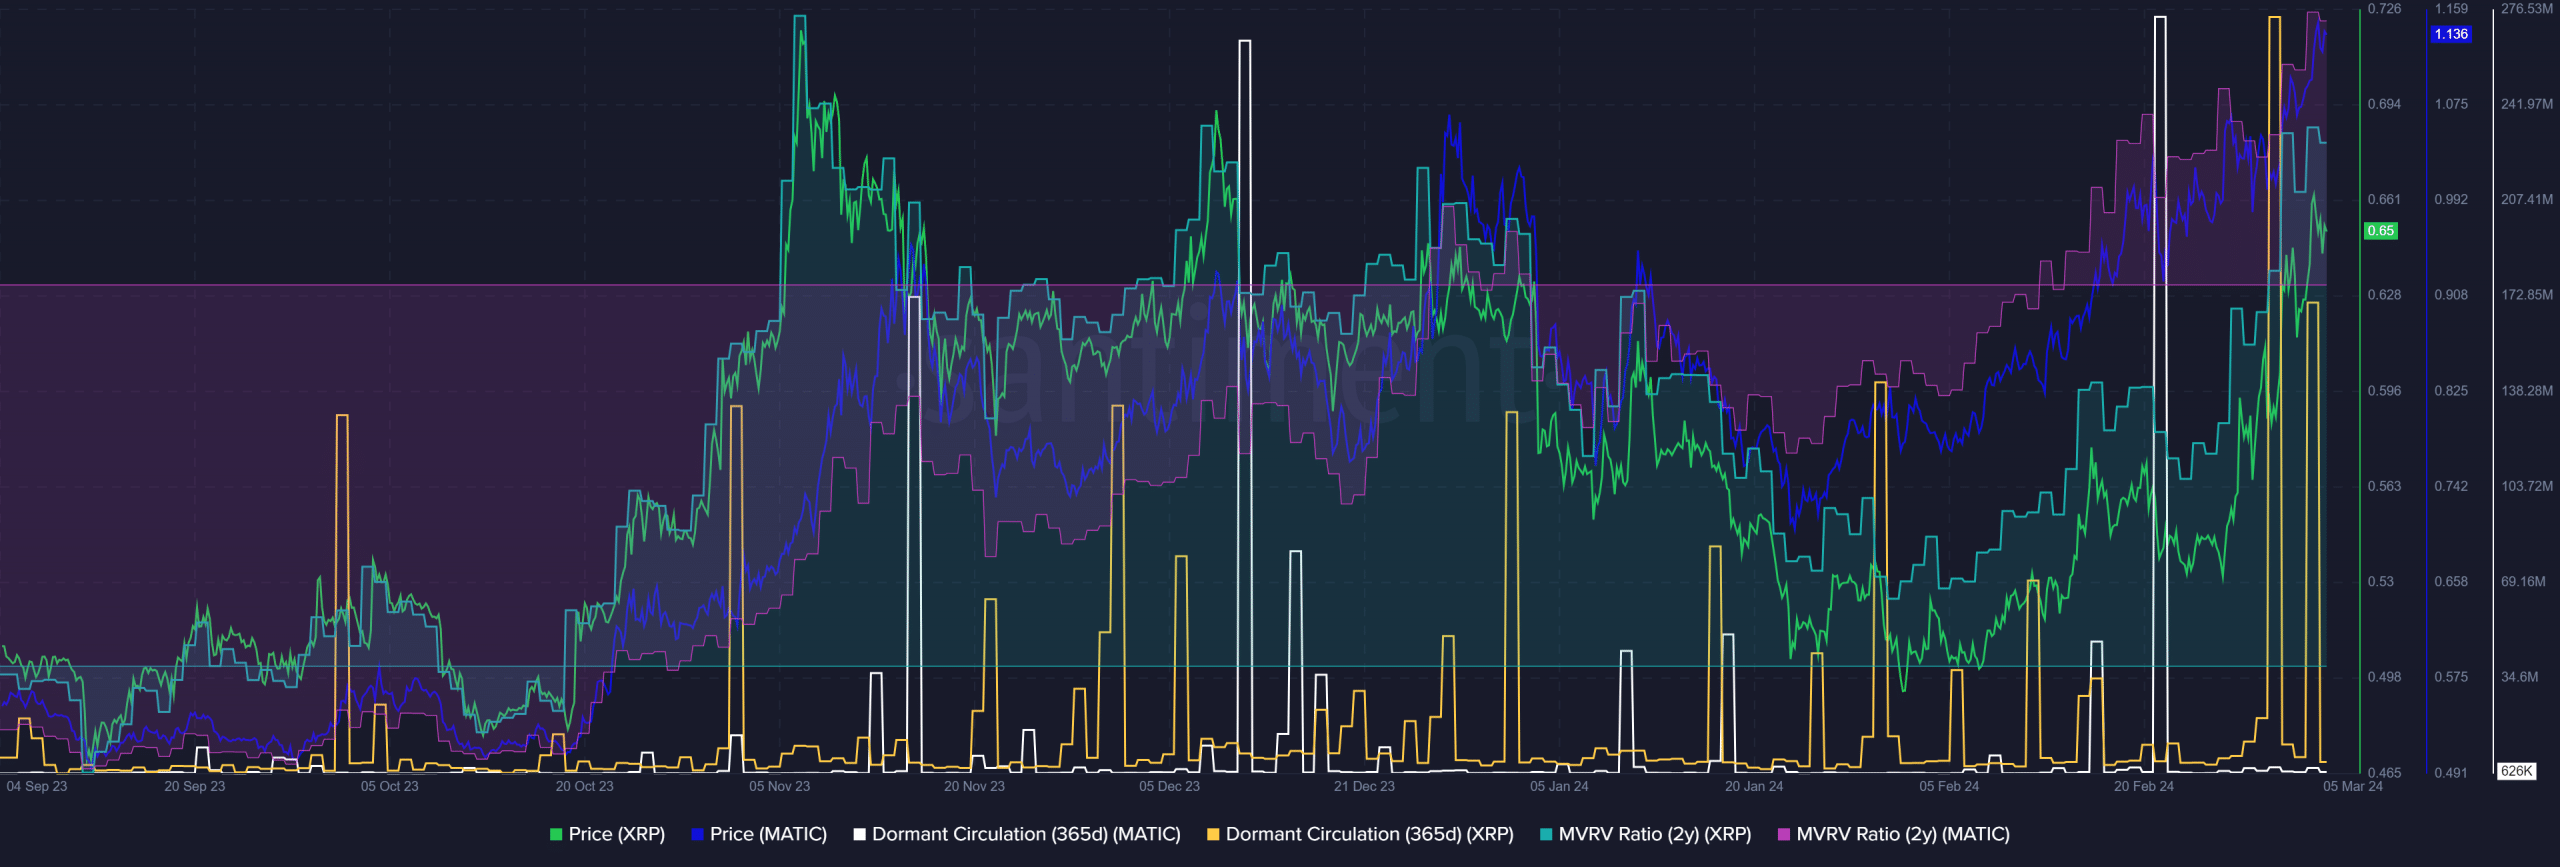
On-chain metrics could shed light on this activity. AMBCrypto analyzed the dormant circulation metric of both XRP and MATIC.
The Santiment chart above for the past six months showed that MATIC saw huge spikes in dormant circulation on the 21st of February. Its size rivaled the December spike when MATIC prices corrected from $0.85 to $0.78 in two weeks.
The same did not occur in February. Instead, MATIC prices soared higher and breached the $1 psychological resistance to reach $1.15. It was a similar scenario for XRP.
Even though the dormant circulation rocketed higher in March, the price correction that followed was shallow and brief. This was in contrast to what happened for XRP on the 30th and the 1st of January.
Dormant tokens waking up en masse on these days was followed by XRP falling from $0.63 to $0.55 by the 8th of January. The second correction lasted two days, and XRP prices went from $0.51 to $0.49.
The inference was that the market sentiment had shifted firmly in favor of the bulls. Even a flurry of selling pressure was quickly bought due to the rising demand.
Examining the higher timeframe price charts
So far, the increased token movement in the past two weeks has not led to the price correction that we witnessed over the preceding three months when the circulation metric climbed higher
. Yet, the approach of critical resistance levels on the price chart could change the dynamics.
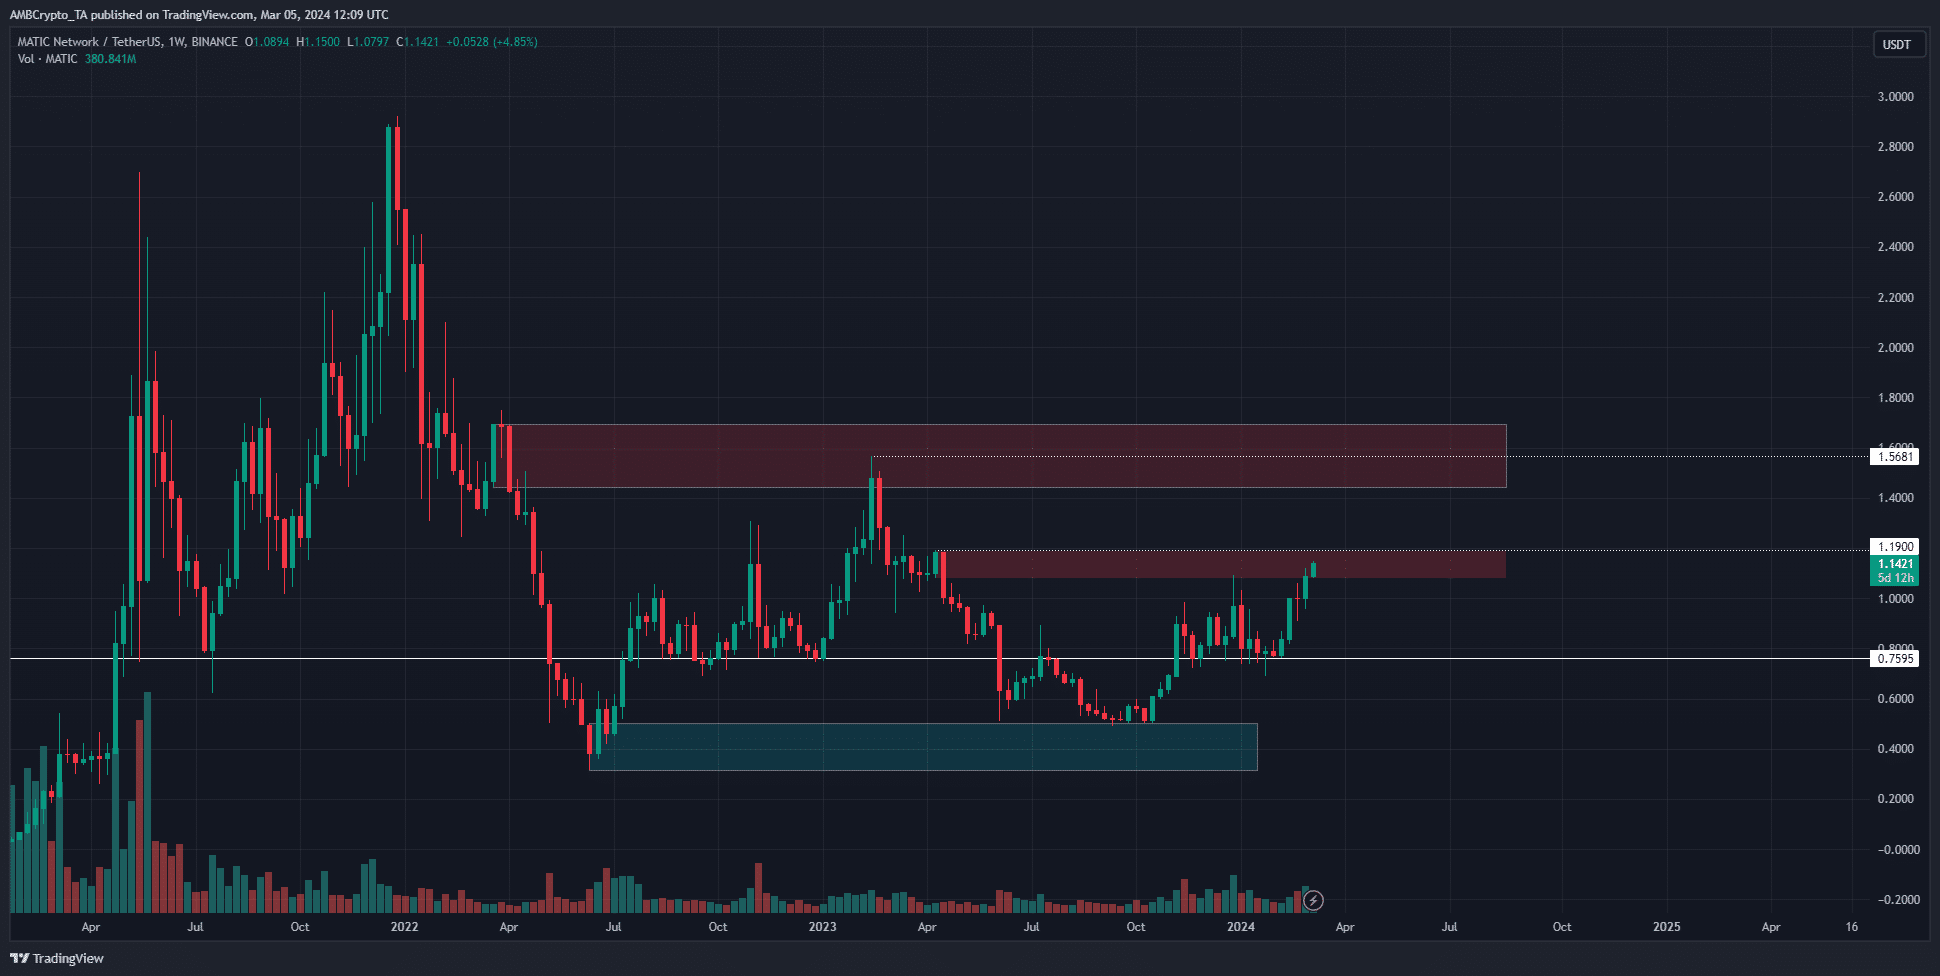
MATIC’s one-week chart showed that the area up to $1.19 represented a supply zone. This region has served as resistance since May 2022, although it was flipped to support briefly in early 2023.
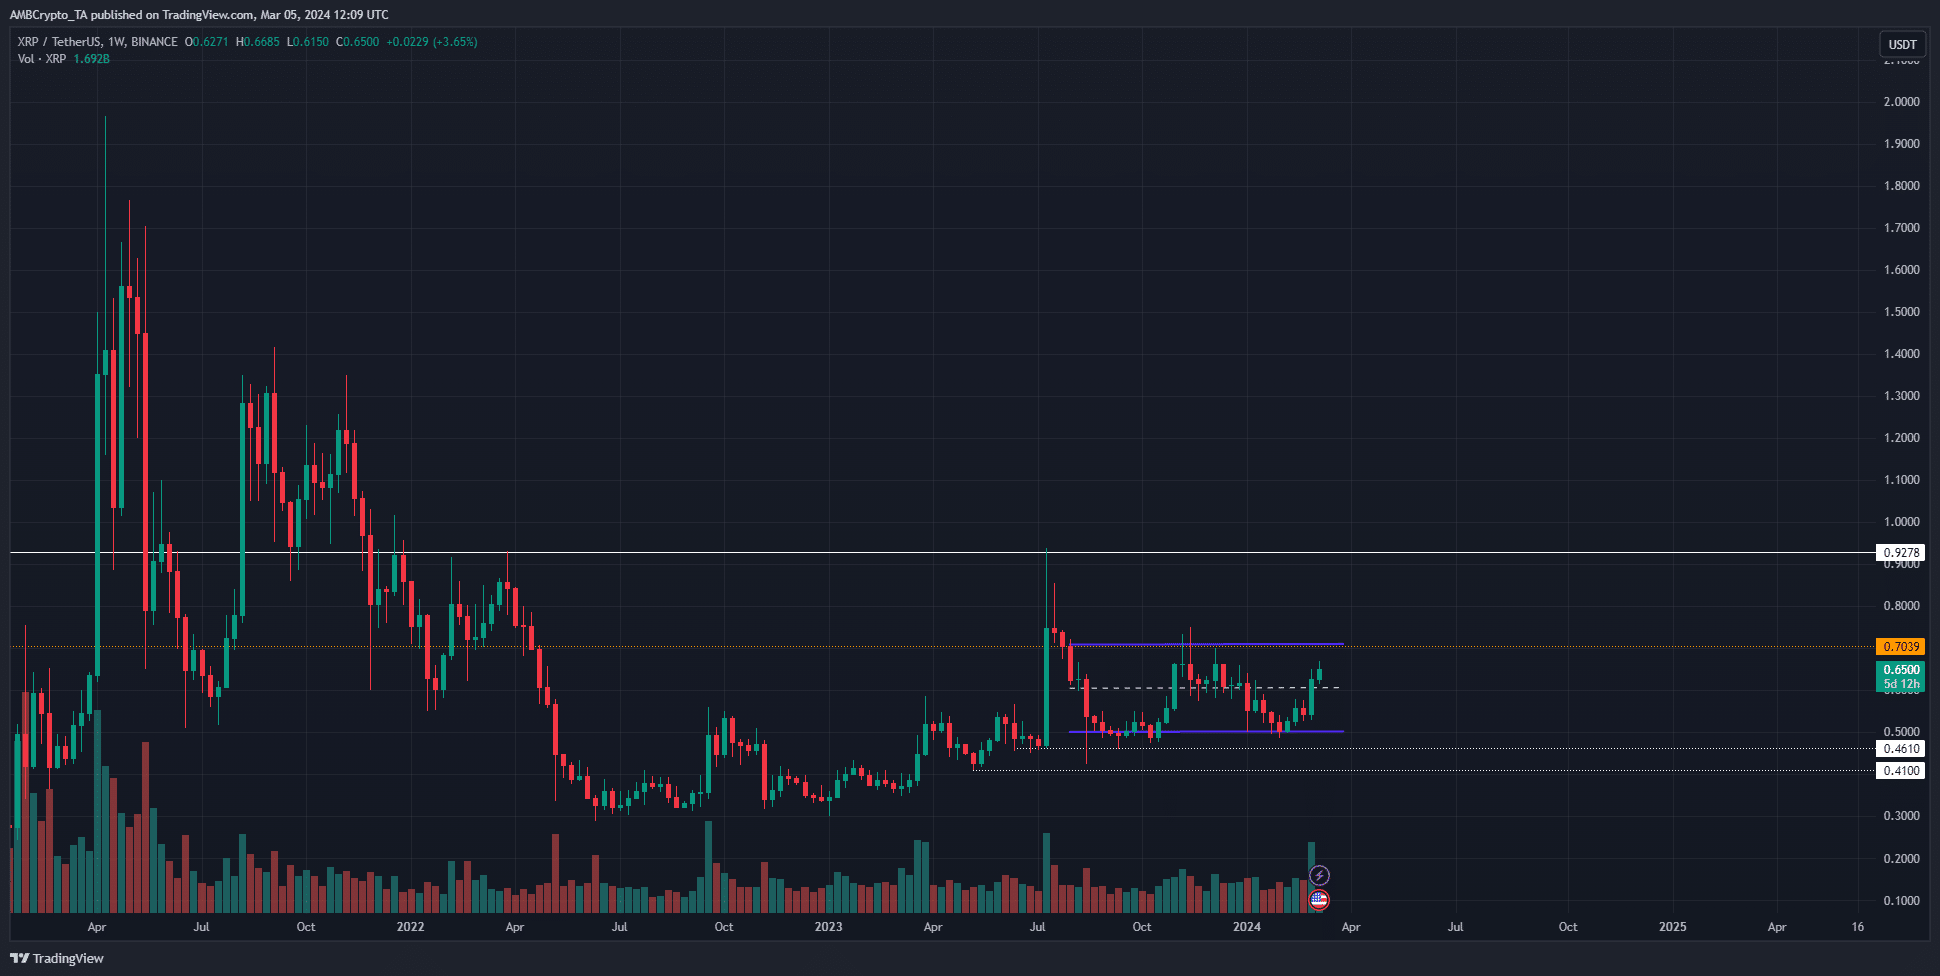
Similarly, XRP was approaching the highs of a nearly 8-month old range. The $0.7 level has been in bearish control since early August 2023.
It appeared likely that the impetus of the past few weeks, both individually for the two tokens as well as across the market, could propel them past the key resistances highlighted.
Is your portfolio green? Check the XRP Profit Calculator
With Bitcoin [BTC] quickly approaching its ATH, and the Fear and Greed Index at 90, another leg higher driven by euphoria is possible.
A rotation of capital into the major caps could well see Ripple and Polygon’s tokens smash aside the zones of supply just overhead.


