Will AAVE lead the DeFi renaissance in 2025? Data suggests…
Despite the DeFi renaissance, AAVE’s daily chart shows looming bearish trends.
- AAVE net deposits surged to an all-time high of $35 billion in 2025 amid renewed interest in DeFi.
- If this network growth continues, it could bode well for AAVE’s price performance in 2025.
The decentralized finance (DeFi) industry experienced a renaissance in 2024 given that by the 17th of December, the Total Value Locked (TVL) had surged to a two-year high of $154 billion.
This growth stirred interest in DeFi protocols and tokens such as Aave [AAVE].
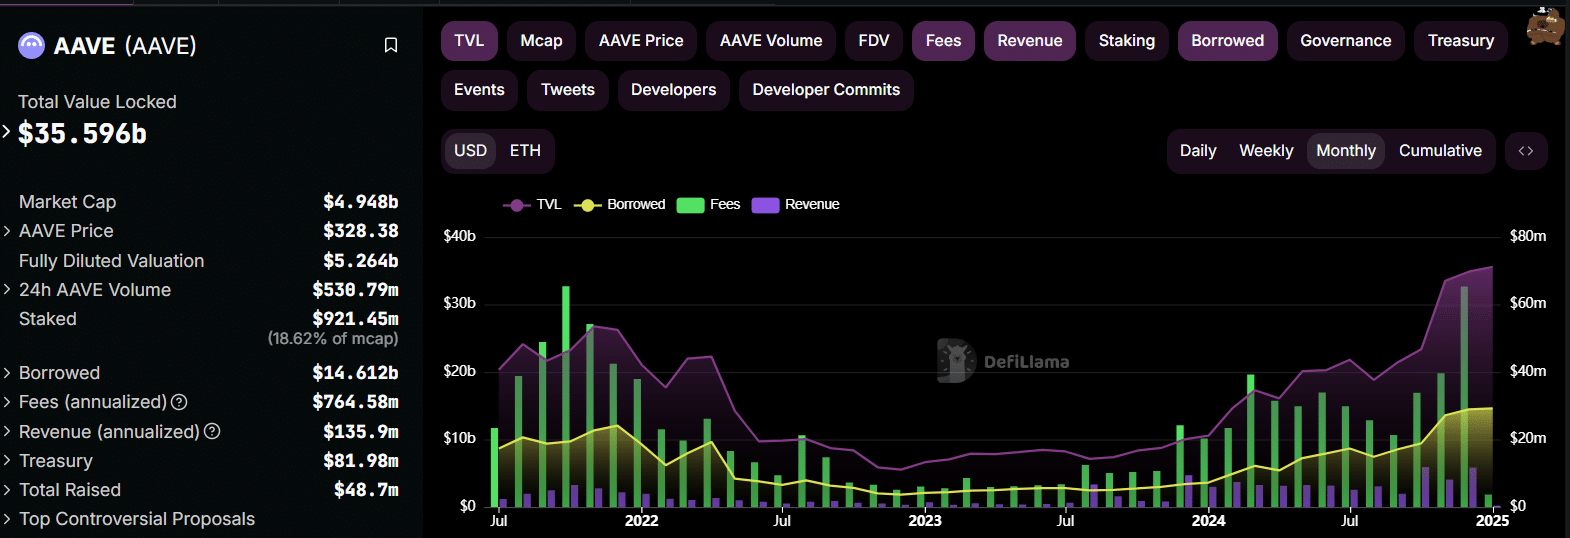
In its yearly review, the AAVE protocol noted that net deposits hit a record high of $35 billion in 2024. Because of this growth, AAVE is now the largest DeFi platform.
Data from DeFiLlama also depicts similar growth after total monthly fees on the protocol rose to a three-year high of $65.34M. At the same time, revenues reached $11.68M.
The total amount borrowed on the protocol has also increased to more than $14 billion.
The rising activity drove AAVE’s price gains in Q4 2024, and if the same growth is recorded this year, it could bode well for the altcoin. However, despite the DeFi renaissance, the token’s daily chart shows looming bearish trends.
AAVE price analysis
AAVE, at press time, traded at $330 after a 6.4% gain in 24 hours. Despite these gains, the token’s one-day chart depicted a bearish double-top pattern.
AAVE had bounced from the neckline of this pattern at $299, indicating that bulls were fighting for control.
If the buying activity depicted by the volume histogram bars continues and AAVE flips resistance at the two peaks ($391), it could invalidate the bearish thesis depicted by the double-top.
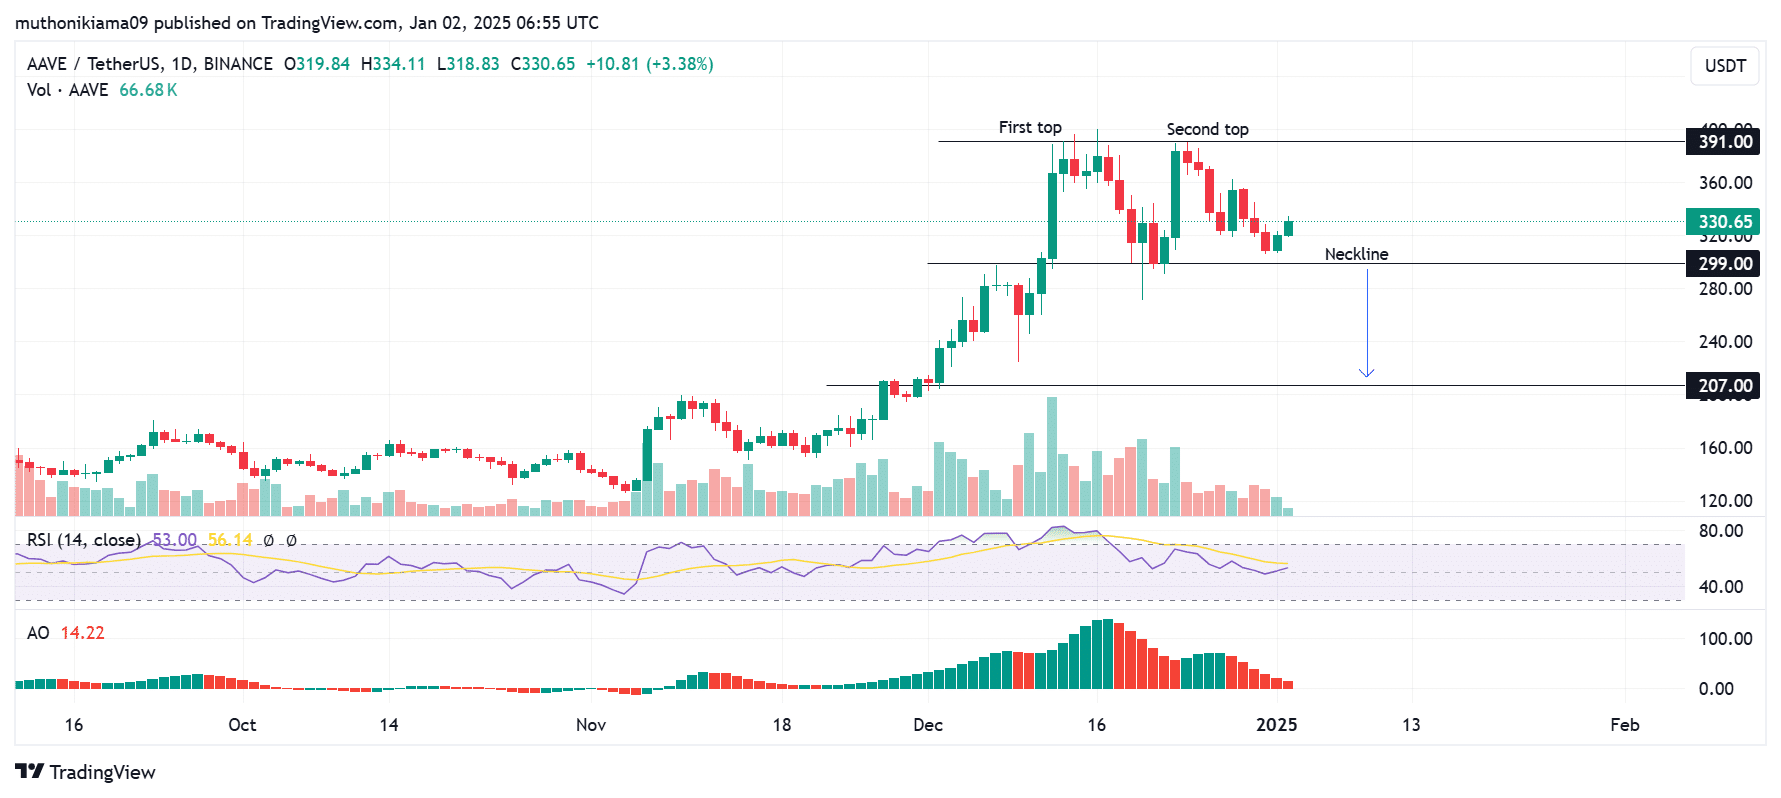
At the same time, the Relative Strength Index (RSI) line was tipping north. If this line crosses above the signal line to form a buy signal, it could ignite a rally toward the $391 resistance level.
The Awesome Oscillator also showed that the bearish trends were weakening due to the shortening histogram bars.
Despite these positive signs, traders should also watch out for the crucial support at the neckline, as a breach below this level could cause a drop to $207.
Long/Short Ratio suggests…
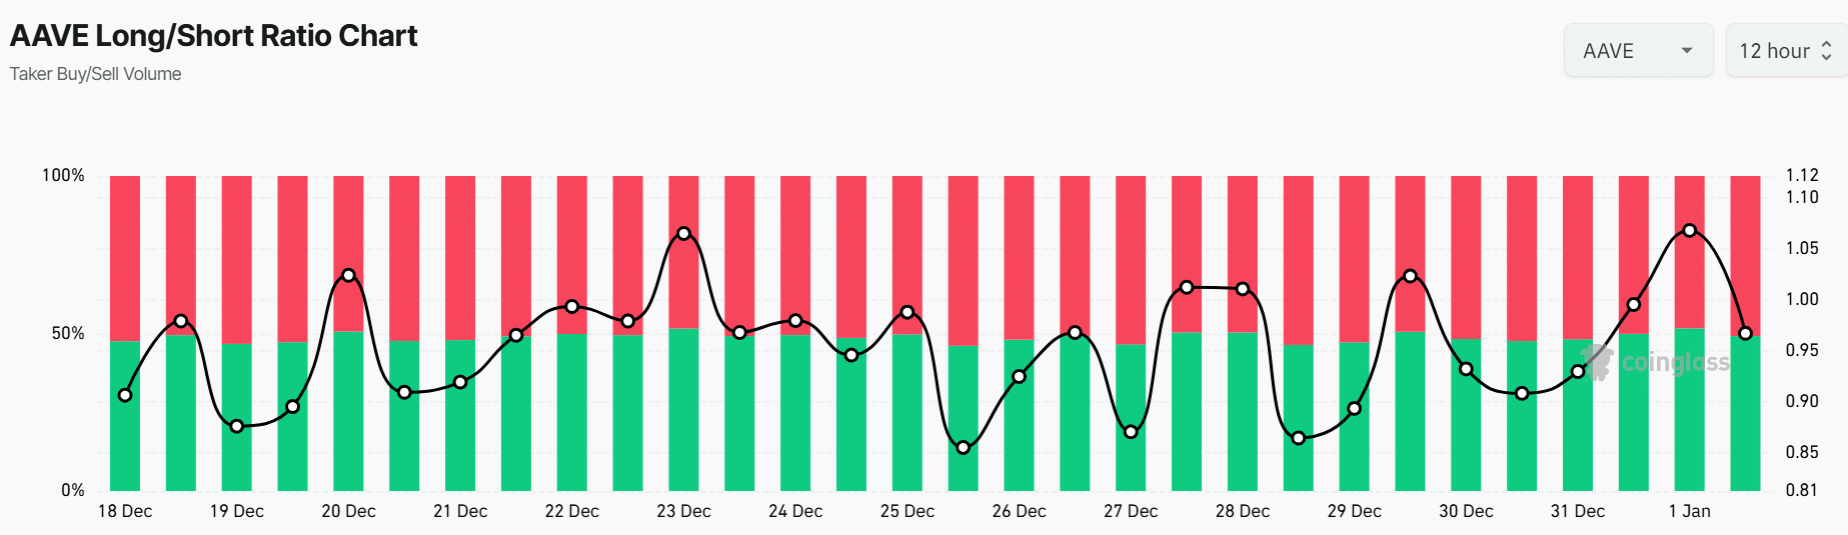
On the derivative front, AAVE depicted a bearish bias due to a decline in the Long/Short Ratio. At press time, this ratio stood at 0.95, suggesting that traders with short positions were slightly more than those with long positions.
Read Aave’s [AAVE] Price Prediction 2025–2026
While this decline could show negative sentiment, an increase in short positions while the price is gaining could result in a short squeeze if these positions are liquidated.
The resulting buying pressure could push AAVE higher.