
- BNB’s price movement and Chaikin Money Flow have created a bearish divergence.
- Other key technical indicators have hinted at the possibility of a price decline.
The past week’s surge in the price of Binance Coin [BNB], coupled with the downtrend of its Chaikin Money Flow (CMF), has created a bearish divergence, suggesting a potential price reversal.
At press time, BNB traded at $586. According to CoinMarketCap, the altcoin’s value rallied by almost 10% in the last week.
During the same period, its CMF indicator assessed on a 24-hour chart initiated a downtrend. This indicator measures money flow into and out of an asset over a specified period.
A bearish divergence occurs when an asset’s price increases while its CMF craters. The discrepancy indicates that despite the price increase, buying pressure is weak. Weakened buying pressure is often followed by a downward correction once buyers in the market are unable to sustain any further price rally.
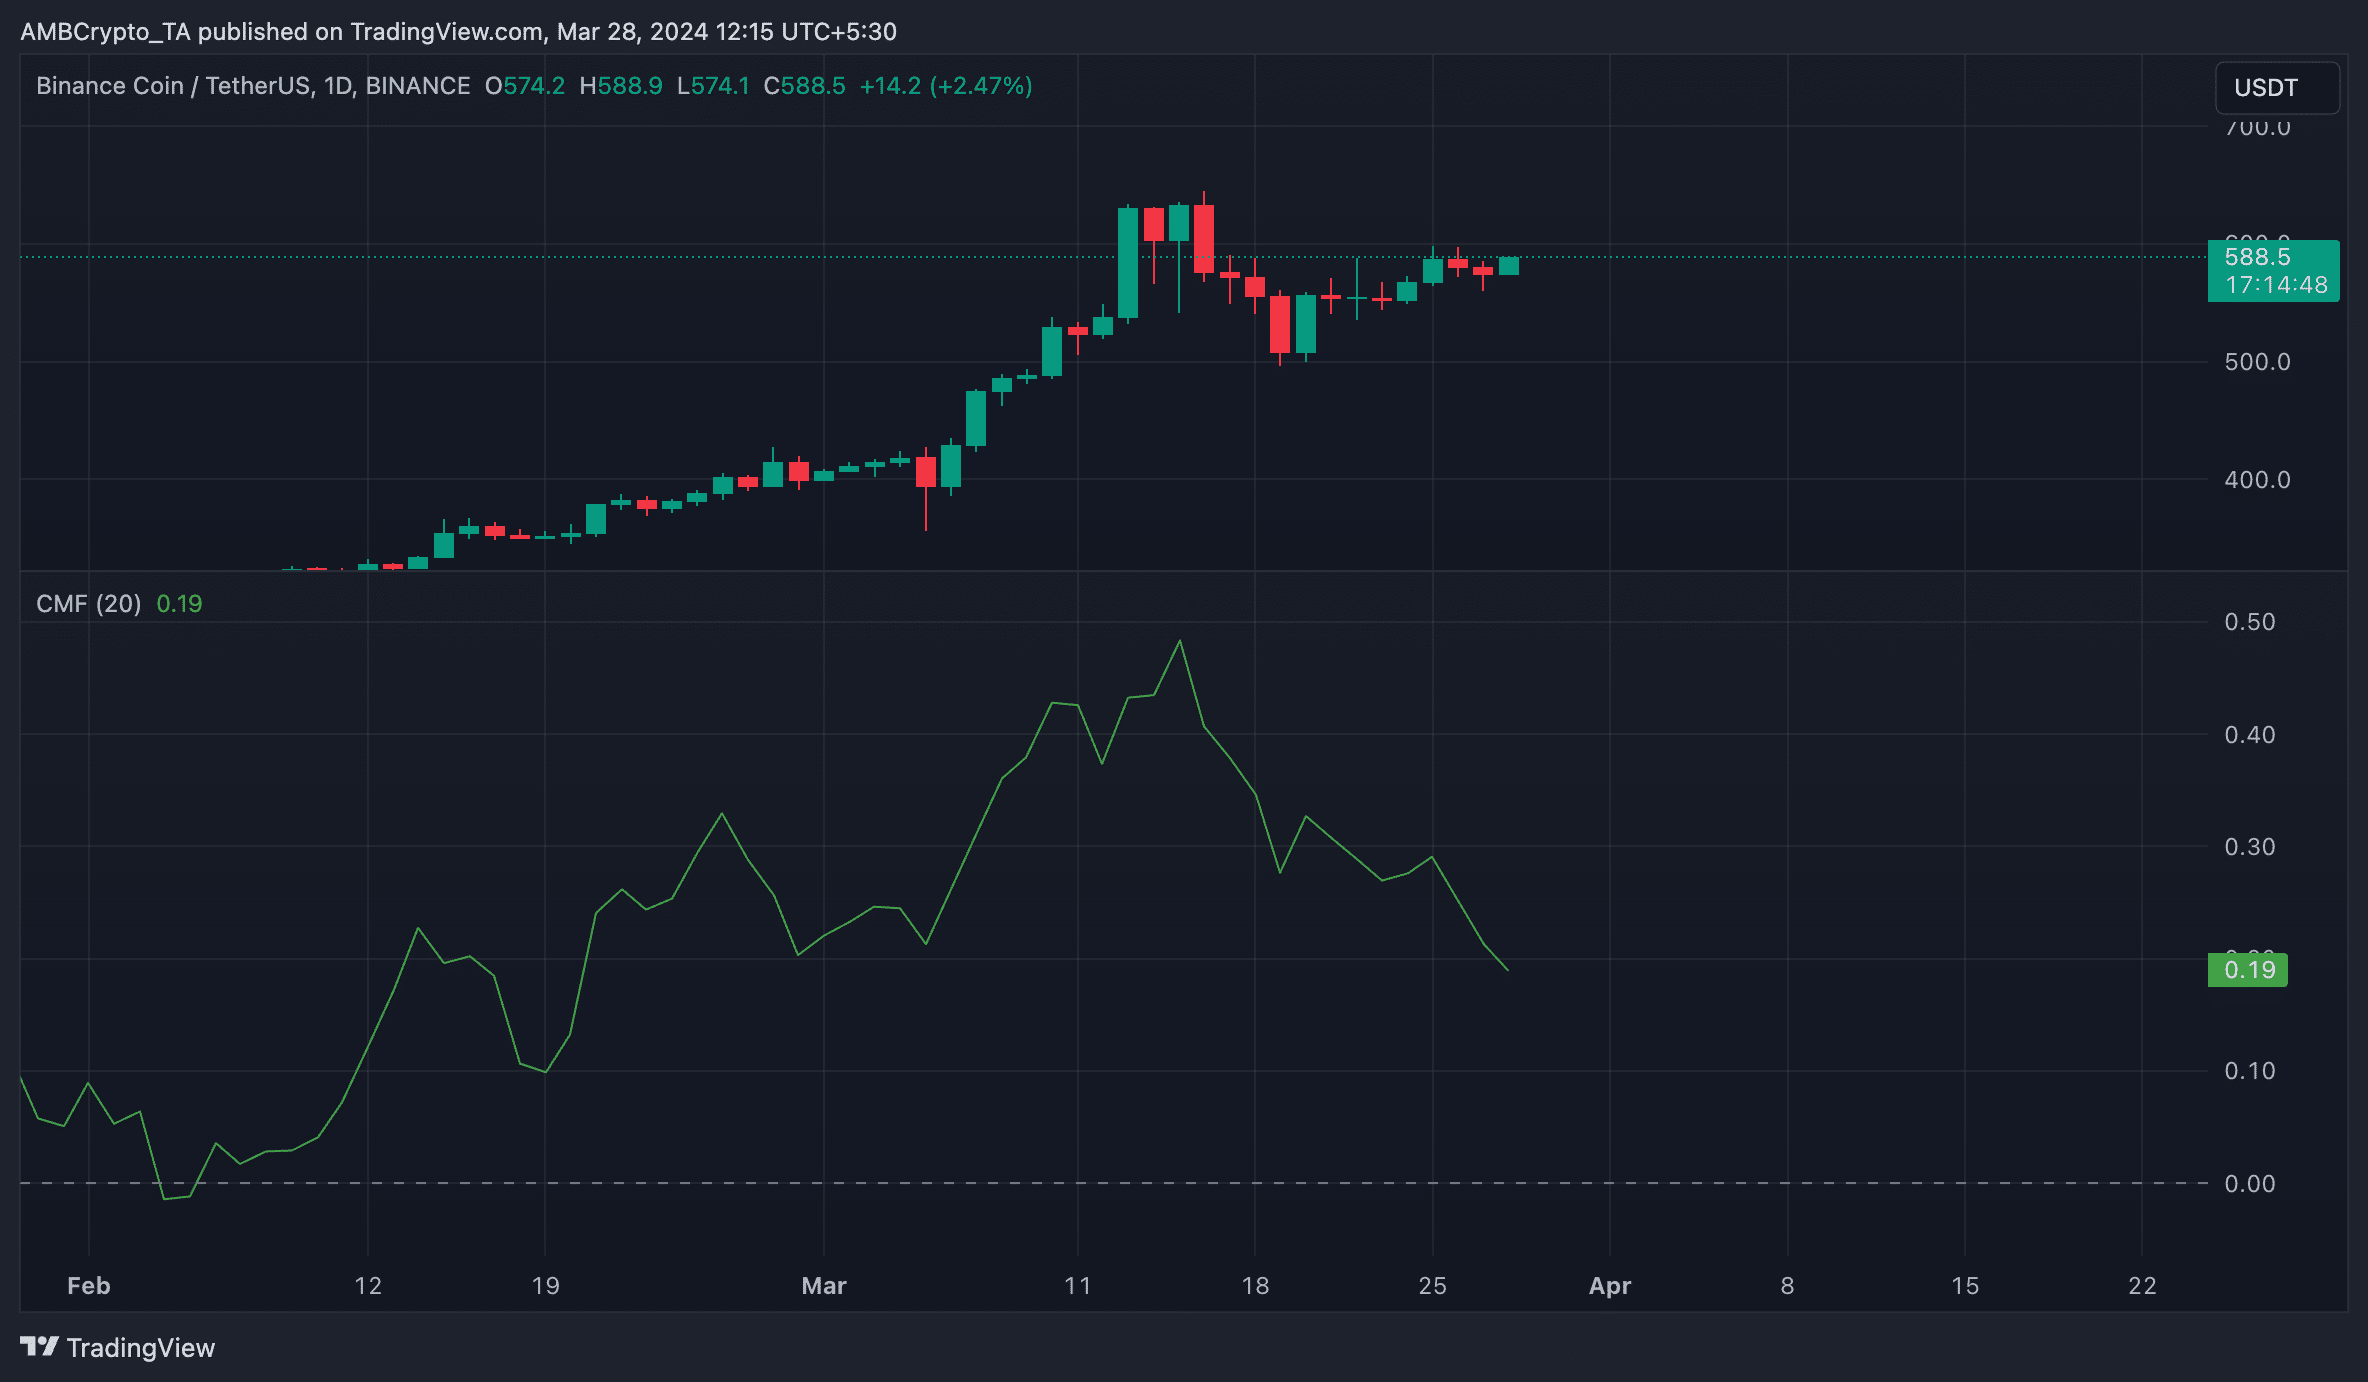
Source: TradingView
Should BNB holders expect a pullback?
A look at some of BNB’s technical indicators on a daily chart revealed that it may shed some of last week’s gains in the short term.
According to readings from its Moving Average Convergence Divergence (MACD) indicator, its MACD line crossed below its signal line on 19th March.
A downward intersection of the MACD line with the signal line is considered a bearish sign, suggesting that an asset’s shorter-term moving average is losing strength relative to its longer-term moving average.
When traders spot this intersection, they take it as a confirmation that market sentiment has shifted from bullish to bearish and that the growth in selling pressure could potentially drive down an asset’s value.
Although BNB’s price has grown by 10% since this intersection, this merely mirrors general market performance. Its price rally has not been backed by any significant demand.
Its Money Flow Index (MFI) indicator, which returned a value of 48.18 and trended downward at press time, showed that selling pressure outpaced buying activity amongst market participants.
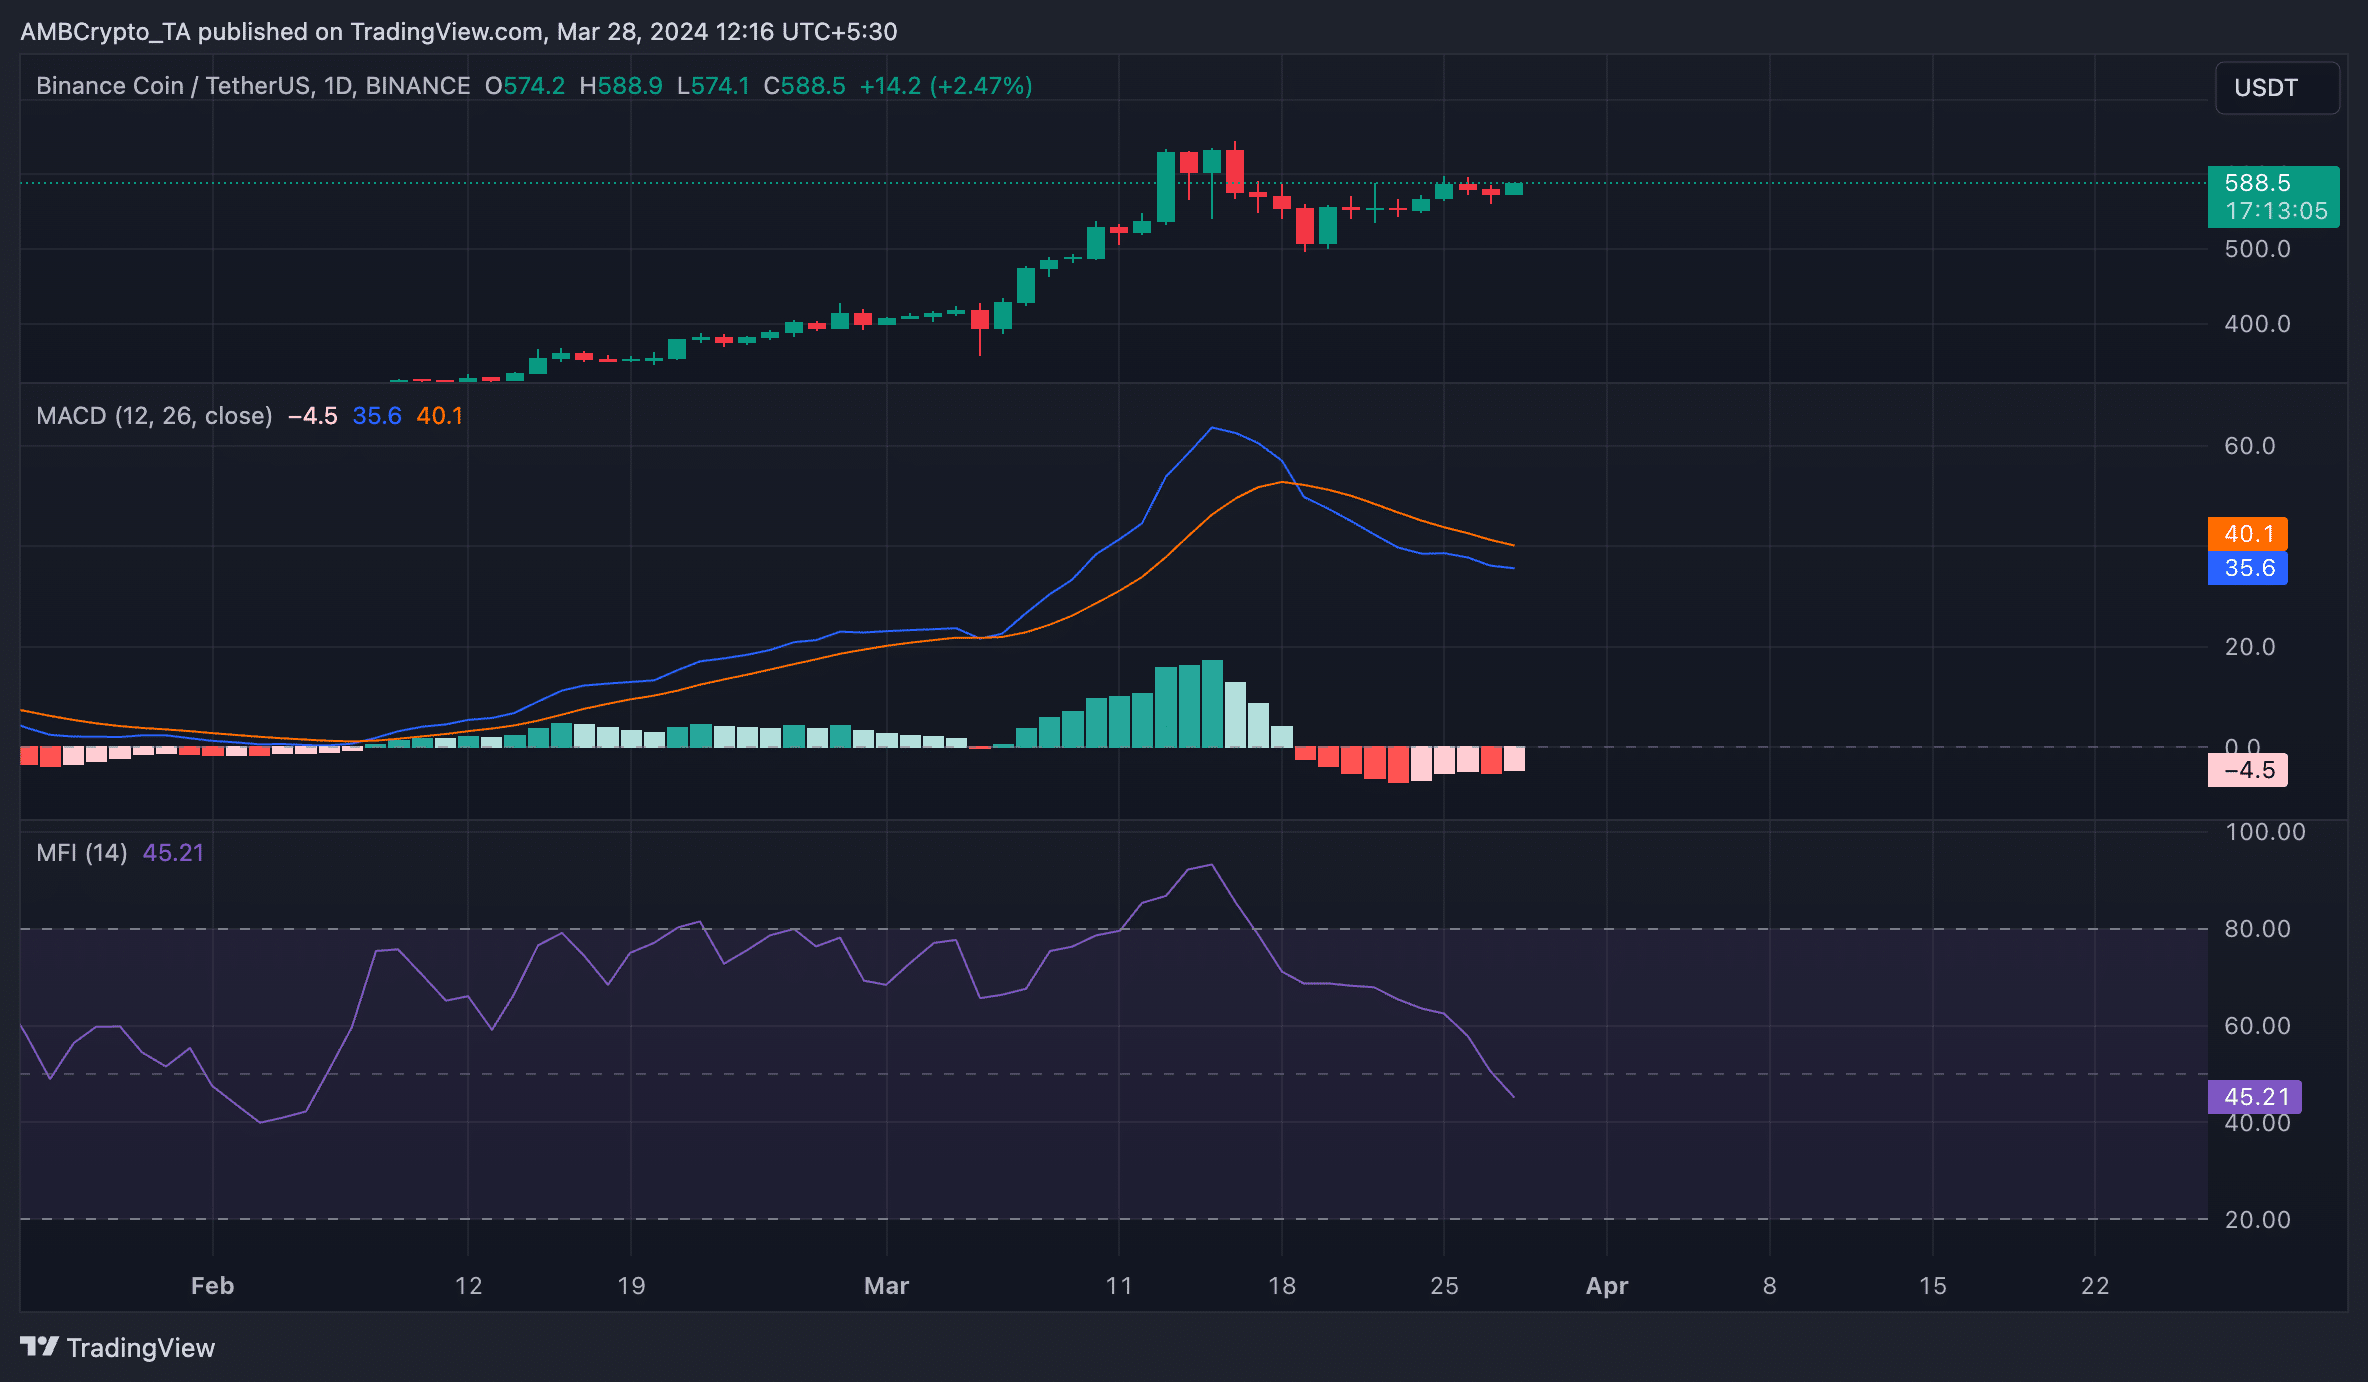
Source: TradingView
Is your portfolio green? Check the Binance Coin Profit Calculator
No cause for alarm
While BNB may appear poised to lose some of its gains, volatility markers showed a low possibility of significant price swings in either direction.
The gap between the upper and lower bands of the coin’s Bollinger Bands (BB) indicator was considerably narrow. This means that price volatility is relatively low. Confirming this, the coin’s Bollinger BandWidth (BBW) trended downward at press time.
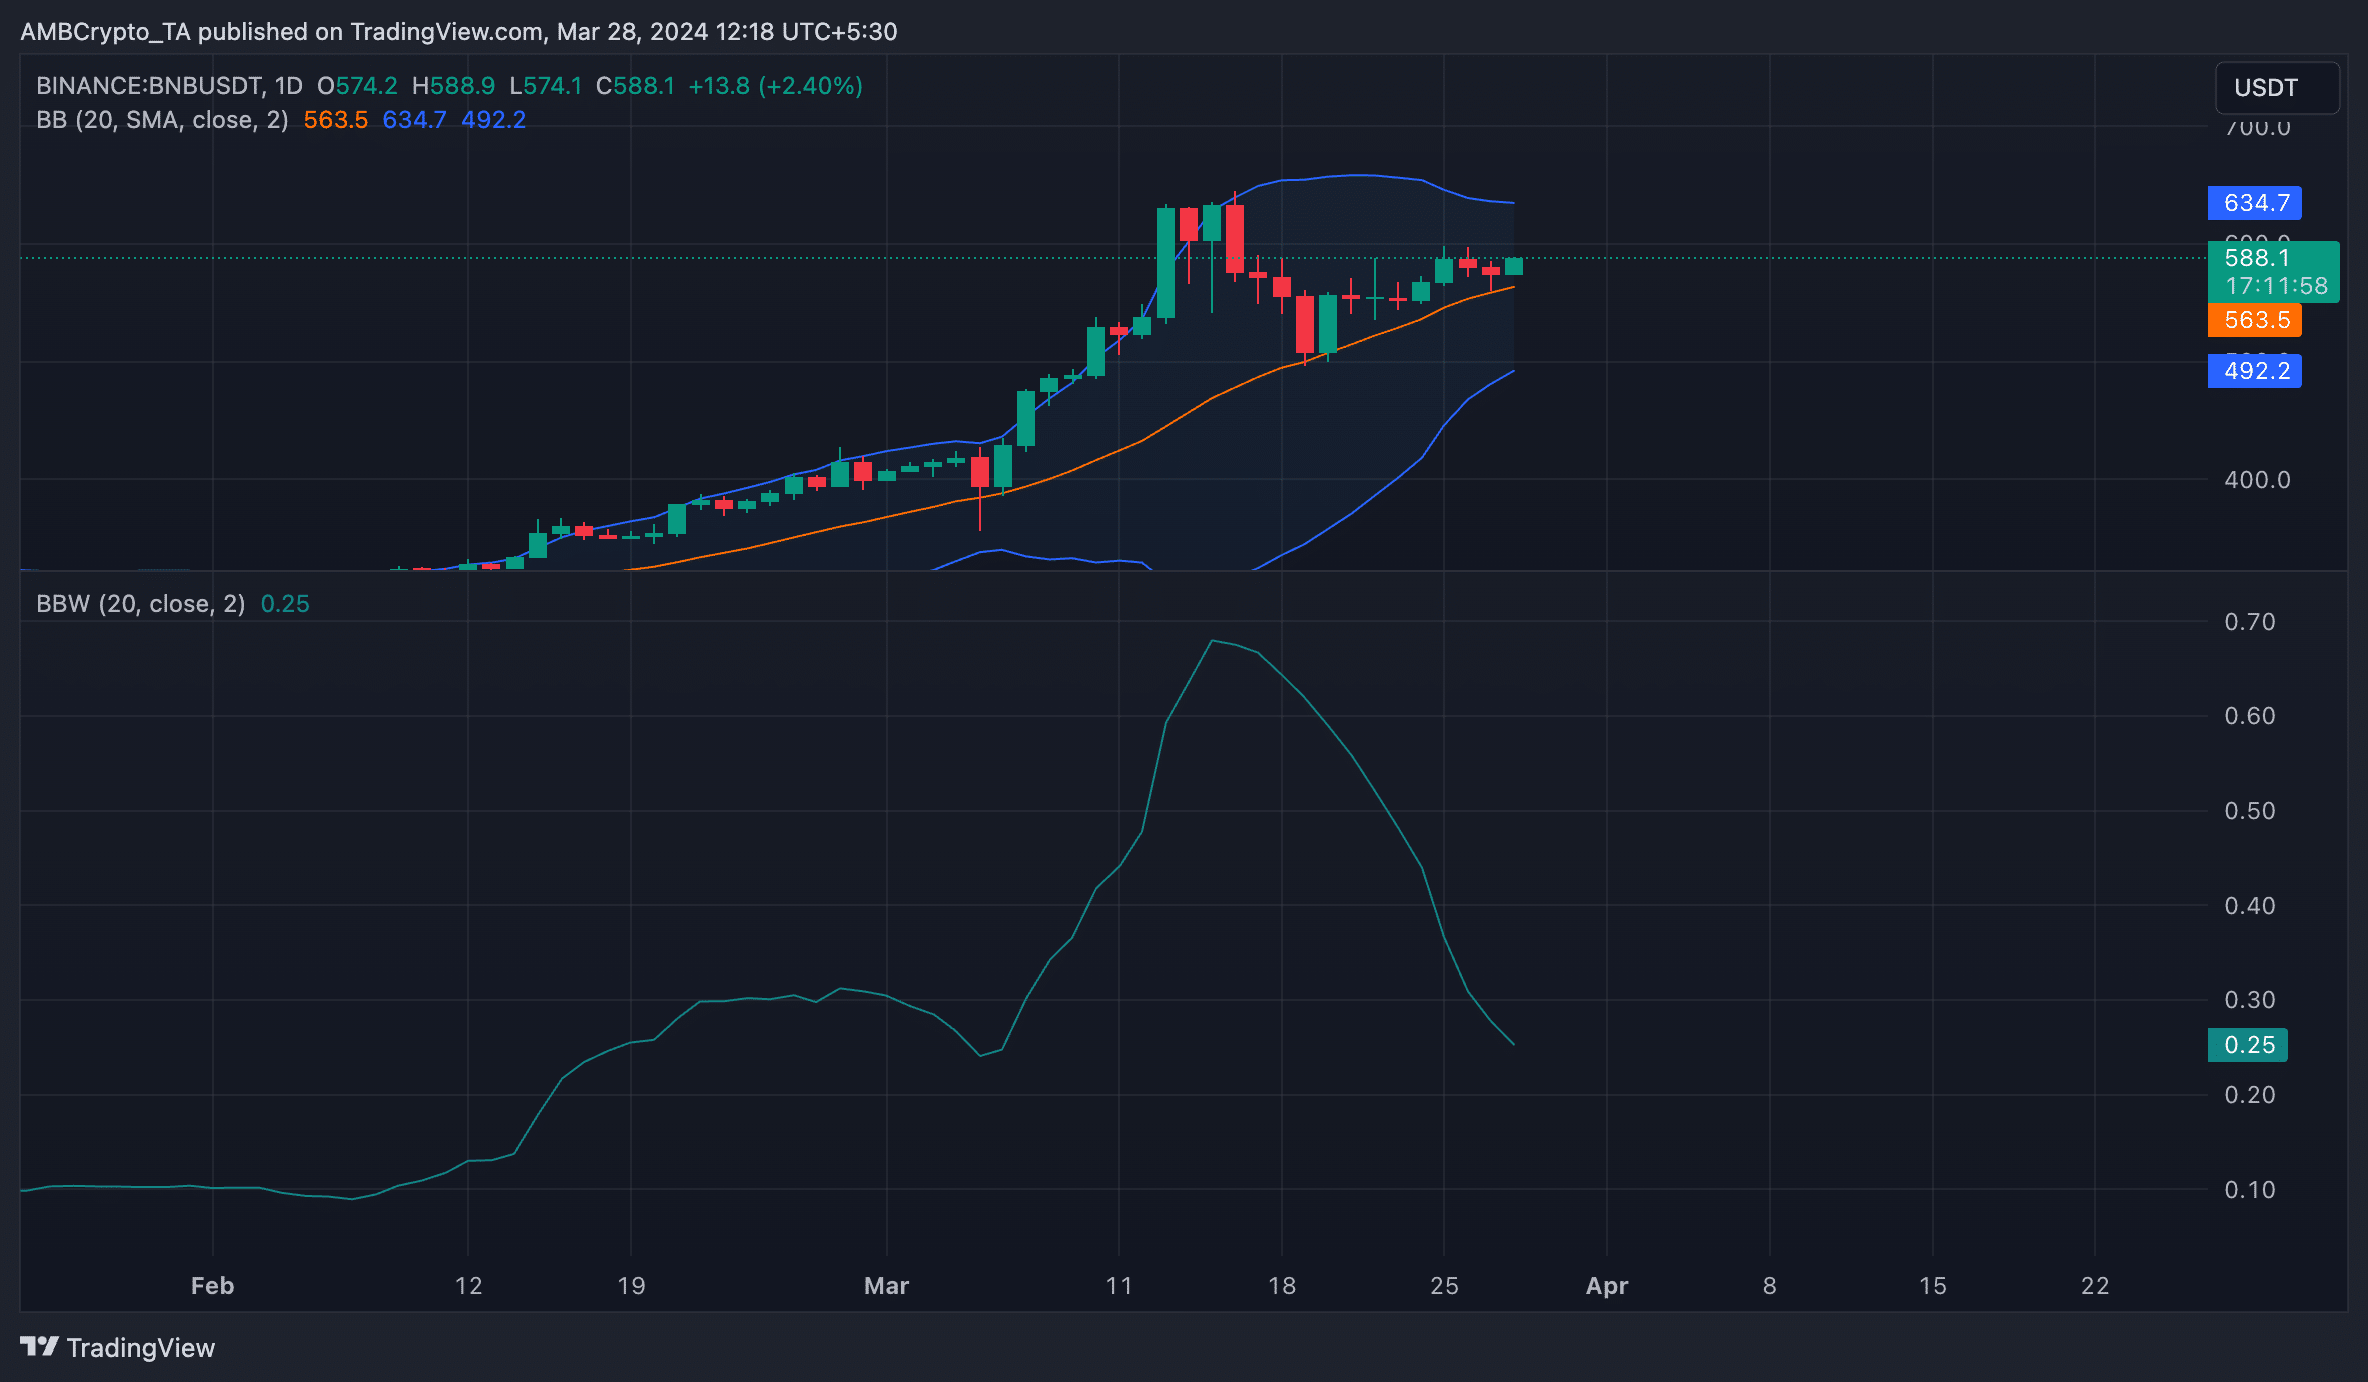
Source: TradingView