Will CASHCAT price fall to $0.08? THESE signals suggest it could
CASHCAT’s bearish technical indicators point to further losses, while positive funding rates suggest futures traders still expect a potential rebound.



Cash Cat [CASHCAT] memecoin has declined significantly over the past day. The decline has resulted in a 12% drop in its market capitalization, bringing it down to $112.31 million at the time of writing.
Market analysis indicates that the price could still drop further in the near term, potentially reaching levels last seen earlier this year. This outlook would hold if traders continue to bet short or sellers maintain their dominance in the market. However, there is still a twist.
CASHCAT faces further downside pressure
The decline in CASHCAT has extended after the cryptocurrency failed to hold the $0.15 support level on the chart.
The decline, however, could extend to the next major support level, which sits around $0.08 on the chart, where the asset could attract buy orders. A decline to this level would imply an additional loss of roughly 25%.
Notably, there are smaller support levels along this stretch, marked by horizontal dashed lines. Price has already traded down to the current level at $0.10, from which a rebound could occur.
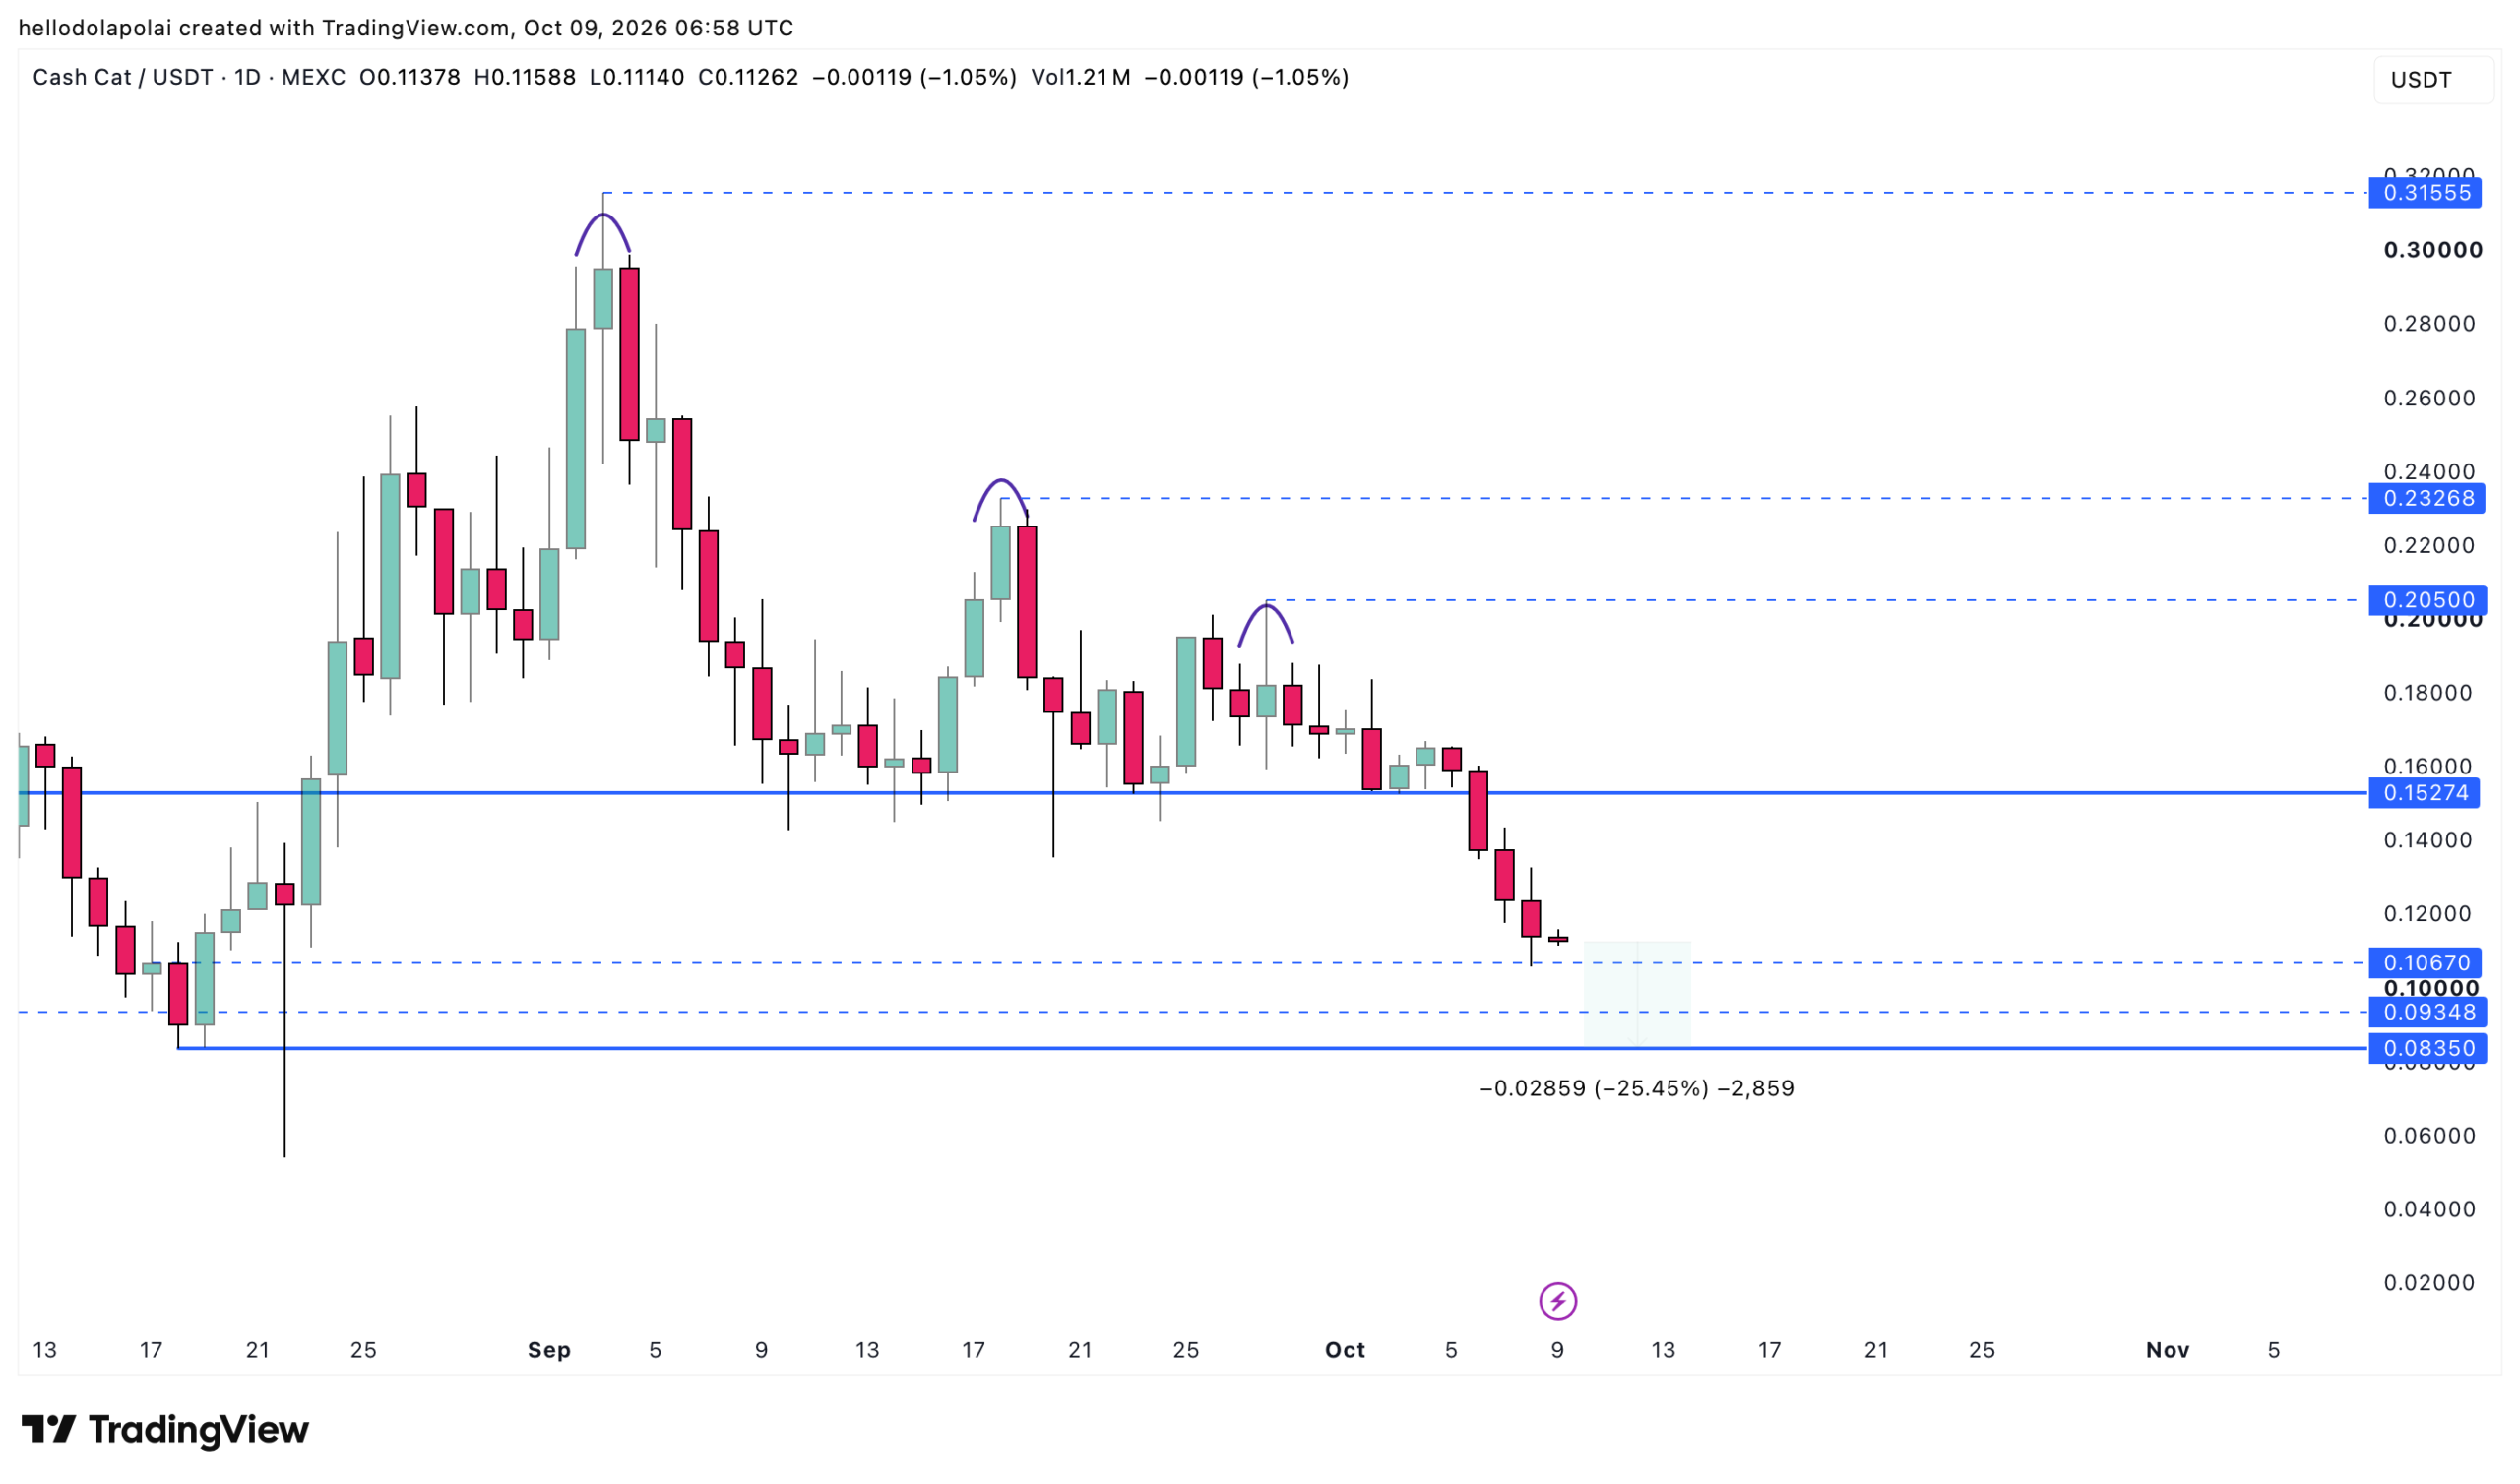
Otherwise, another minor support level sits around $0.09, where the price could extend its decline before potentially surging upward.
Traders should prepare for the most bearish scenario, however, as the broader market remains in a downtrend, with Bitcoin [BTC] dropping below $80,000 for the first time in a week on the 8th of October.
Bearish indicators point to further losses for CASHCAT
The Bull Bear Power (BBP), which measures the strength of buying and selling pressure to determine which side dominates the market, confirms that sellers are in control.
The BBP has, in fact, formed one of its most bearish bars in the past 24 hours. Data from the TradingView daily chart shows that this is the most bearish bar the indicator has formed in four weeks, or exactly 29 days.
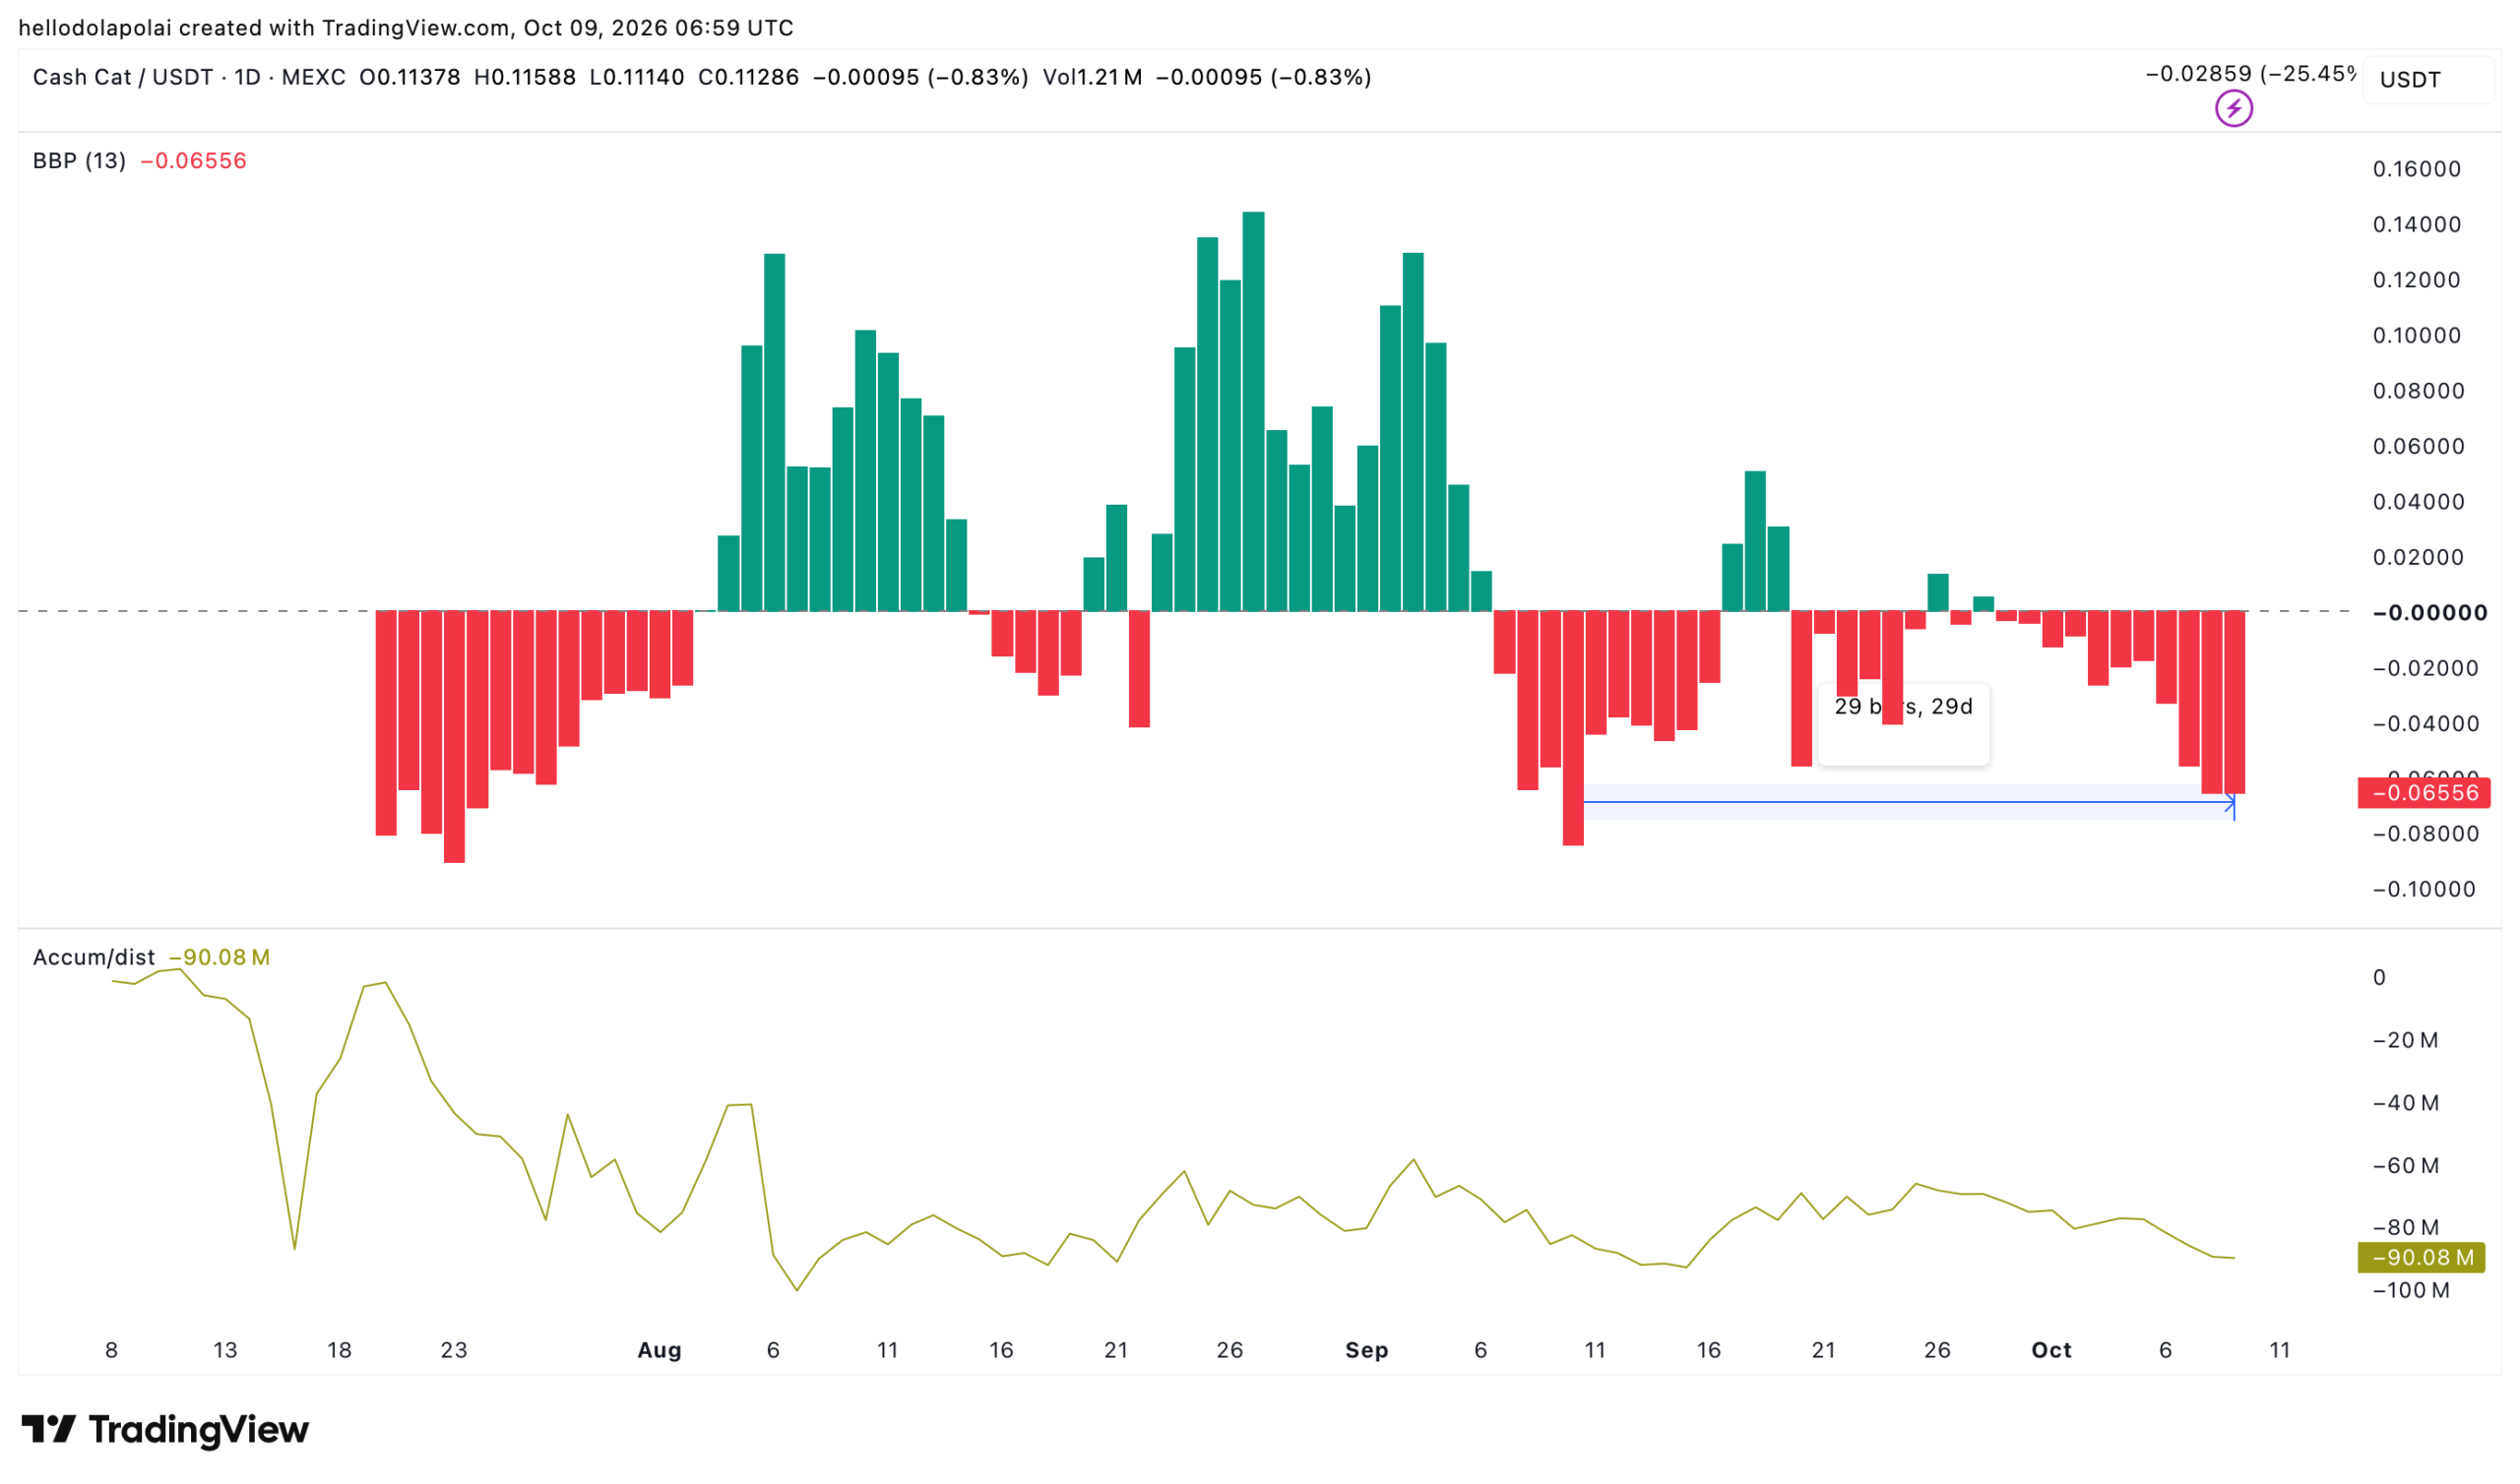
This bearish sentiment could extend further and lead to additional losses, according to the Accumulation/Distribution (A/D) indicator, which has continued to fall deeper into negative territory.
The negative territory on the A/D indicator suggests that investors are broadly selling the asset. Continued declines in the indicator would confirm persistent selling pressure and suggest that the asset could fall even further in the short term.
Both indicators point to broader weakness, leaving further downside possible, with the lower support levels serving as key targets.
Positive funding rate keeps rebound in play
An analysis of the Futures market shows that traders remain positioned for a bullish move, according to the Funding Rate chart.
The Funding Rate measures the balance between long and short positions in the perpetual futures market, with the side holding the dominant position paying the periodic fee.
At the time of writing, long traders were paying the fee, as the Funding Rate remained around 0.0032% on the chart. This suggests that bullish positions dominate the perpetual futures market, with $43.95 million concentrated on the long side.
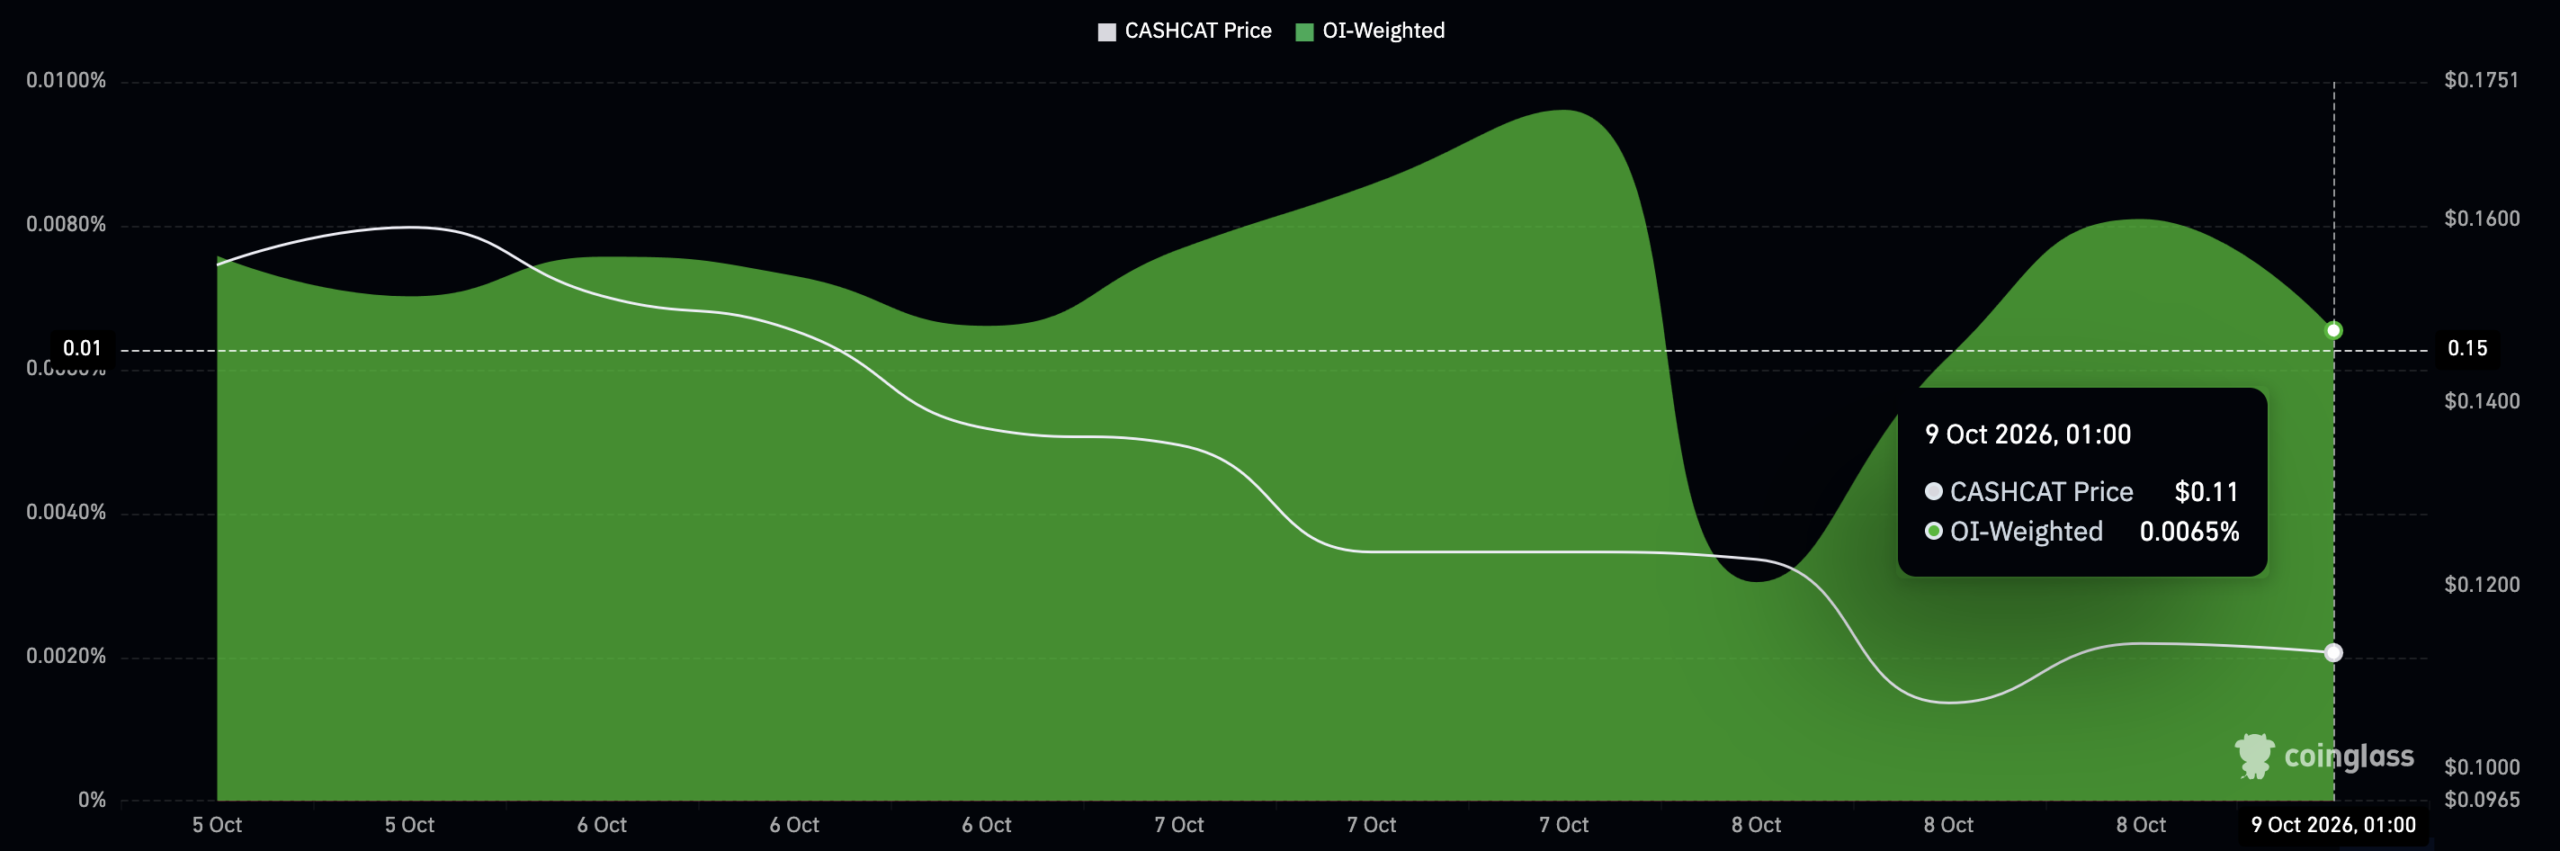
However, traders have maintained moderate positions, limiting their exposure to price movements at the time of writing.
This outlook suggests that a rebound remains possible, meaning traders should not become overly bearish on CASHCAT at this point.
Final Summary
- CASHCAT risks a further decline toward $0.08 if selling pressure persists and the price fails to hold its current support levels.
-
The positive Funding Rate of 0.0032% suggests bullish positioning in the futures market, leaving room for a potential rebound despite bearish technical indicators.