Will Chainlink’s potential bull flag lead LINK to $50? Gauging…

- If the market supports Chainlink’s bullish structure formation, then LINK might rally to $50.
- Hpwever, a short-term pullback can be expected first.
A week of price hikes, Chainlink [LINK] somewhat seemed to have entered a consolidation zone. Nonetheless, the token managed a breakout above a multi-year pattern.
Though the coming few days might be quite, a push from the overall market could send LINK to new highs.
Chainlink’s next plan
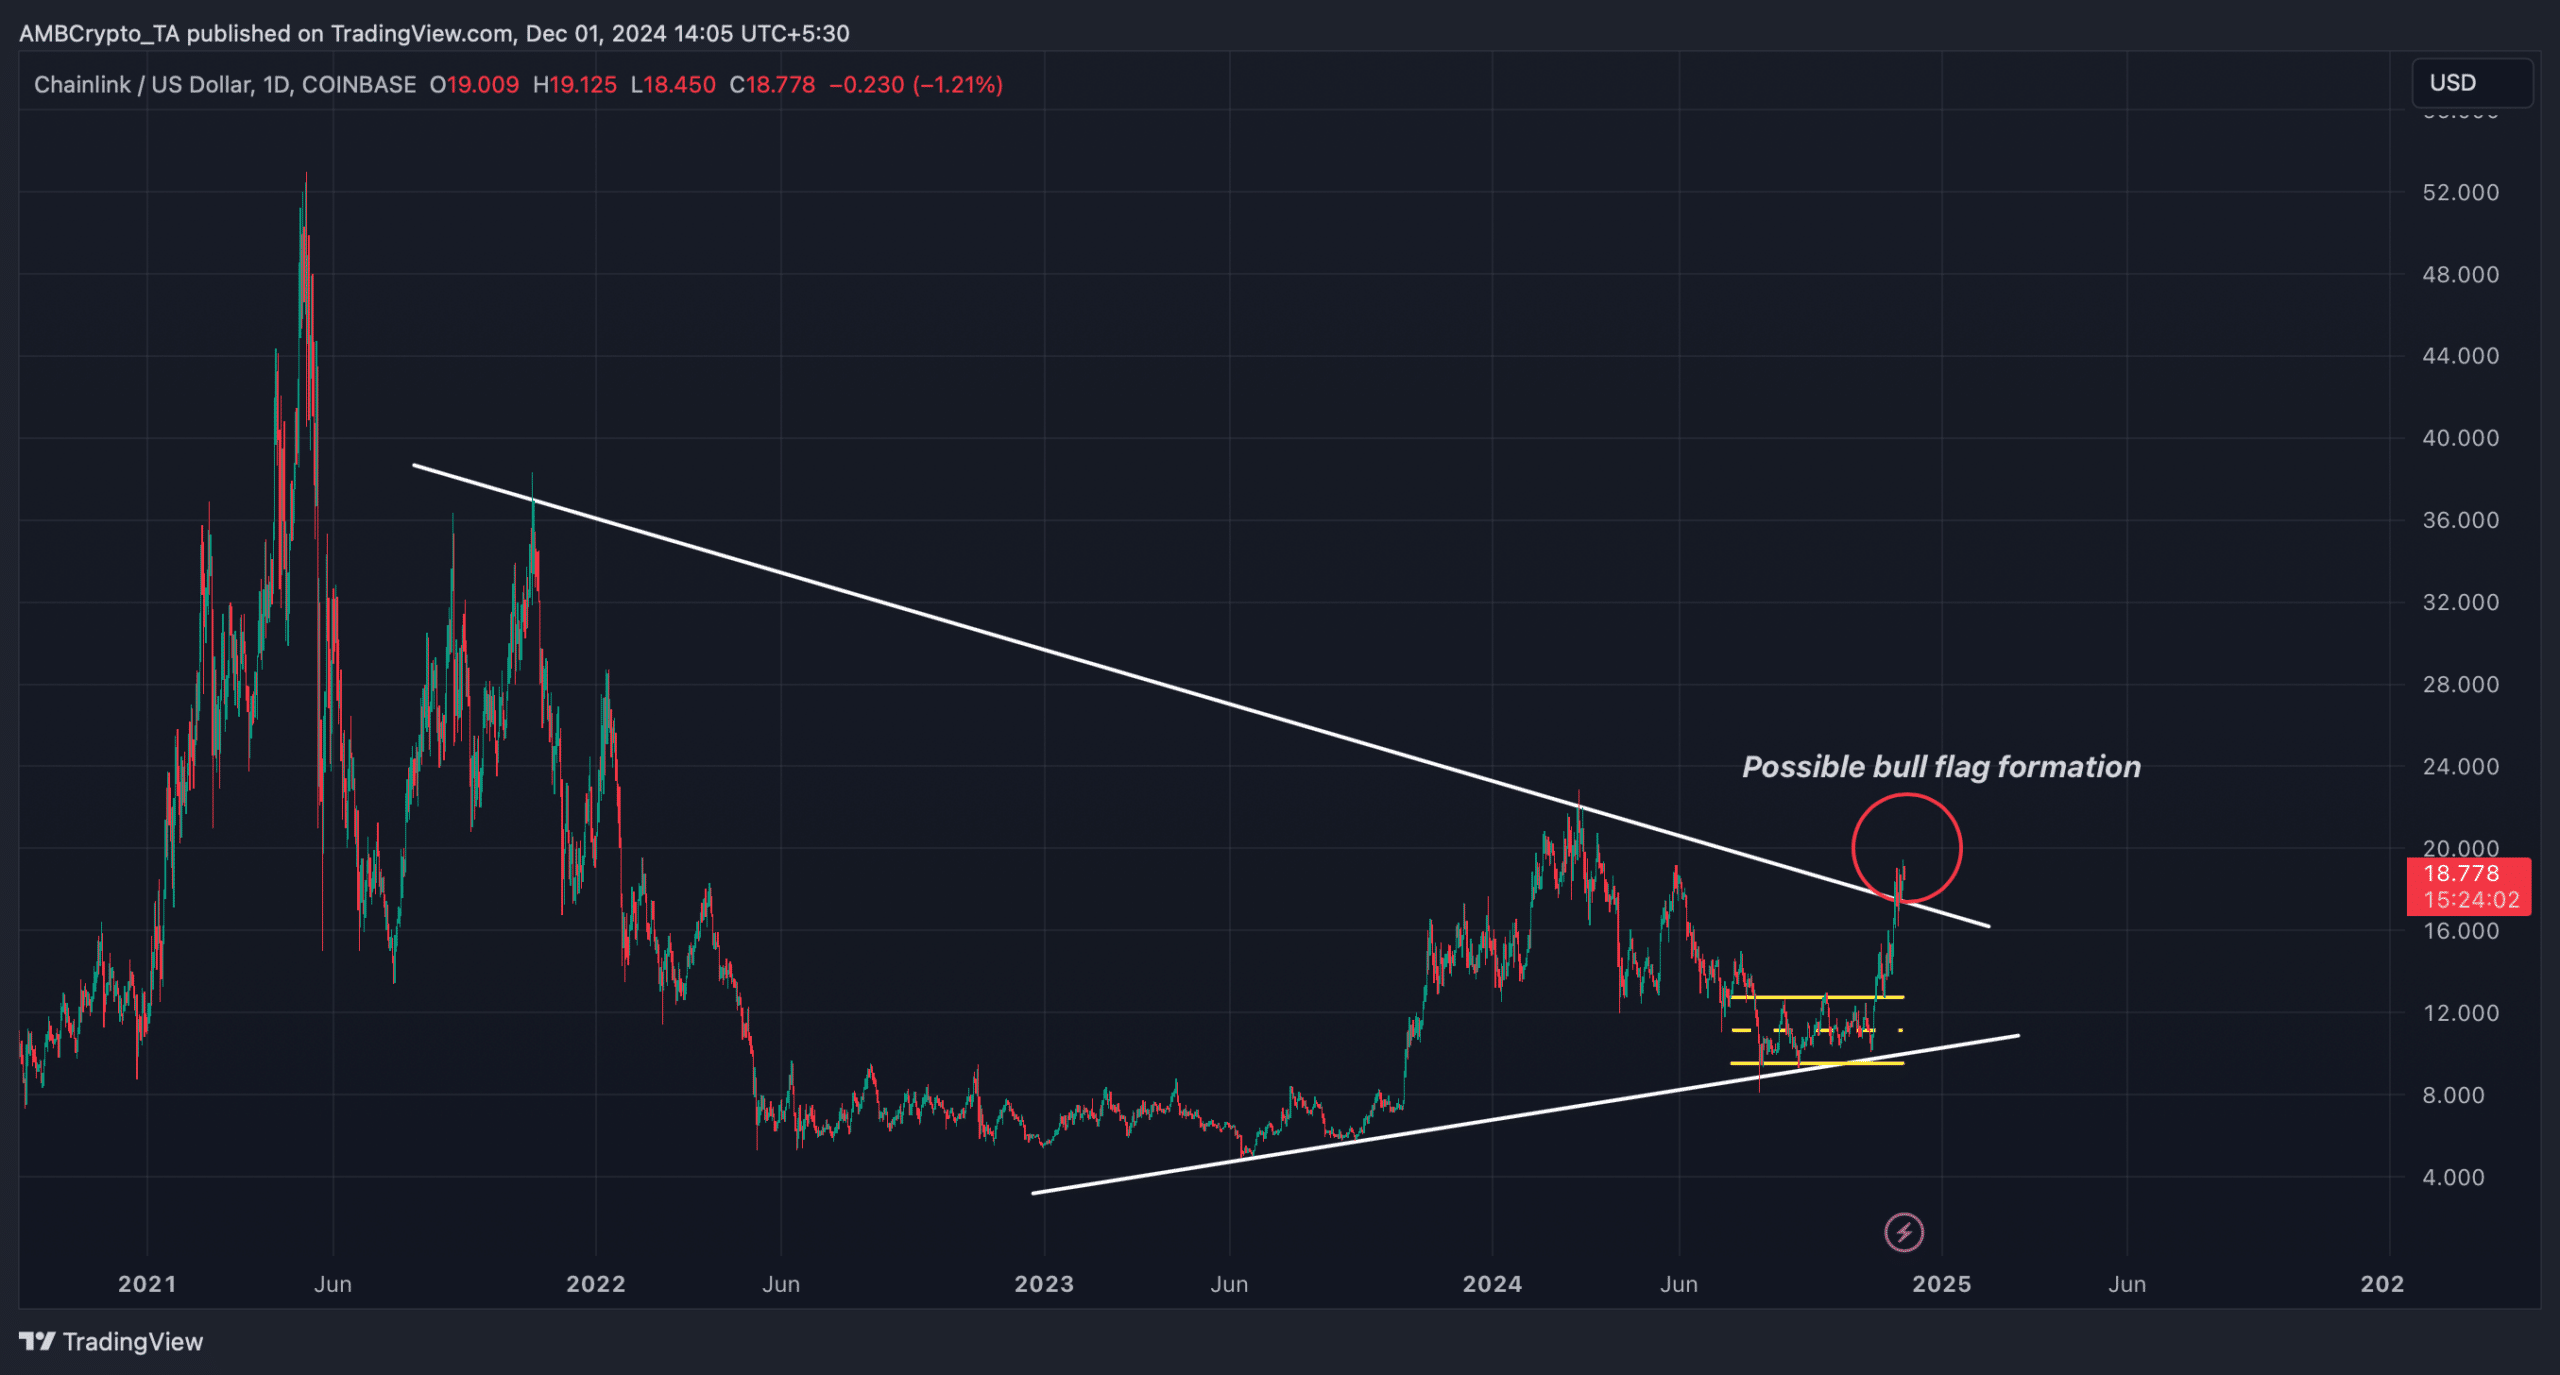
AMBCrypto’s analysis of the token’s daily chart revealed a notable development. A bullish symmetrical triangle pattern emerged on LINK’s chart in 2021.
Since then, the token’s price has been consolidating inside it, only to break out a few days ago. After the breakout, LINK’s upward momentum declined.
But this just be the beginning of a new chapter. The breakout suggested that there are possibilities of LINK forming a bullish flag pattern.
If that happens and market conditions align, LINK might retest its ATH and reach $50 in the coming months.
A breakout above the bull flag amidst an altcoin season could trigger this massive rally. In fact, latest datasets suggested that the altcoin season might arrive sooner than expected.
AMBCrypto reported a few days ago that BTC’s dominance slipped under a crucial support. In the meantime, the altcoin season index moved up sharply, indicating that altcoins might start shining from December itself.
What’s there in the short-term?
Since expecting Chainlink touch $50 is a long-term assumption, AMBCrypto checked metrics to find what to expect in the near term.
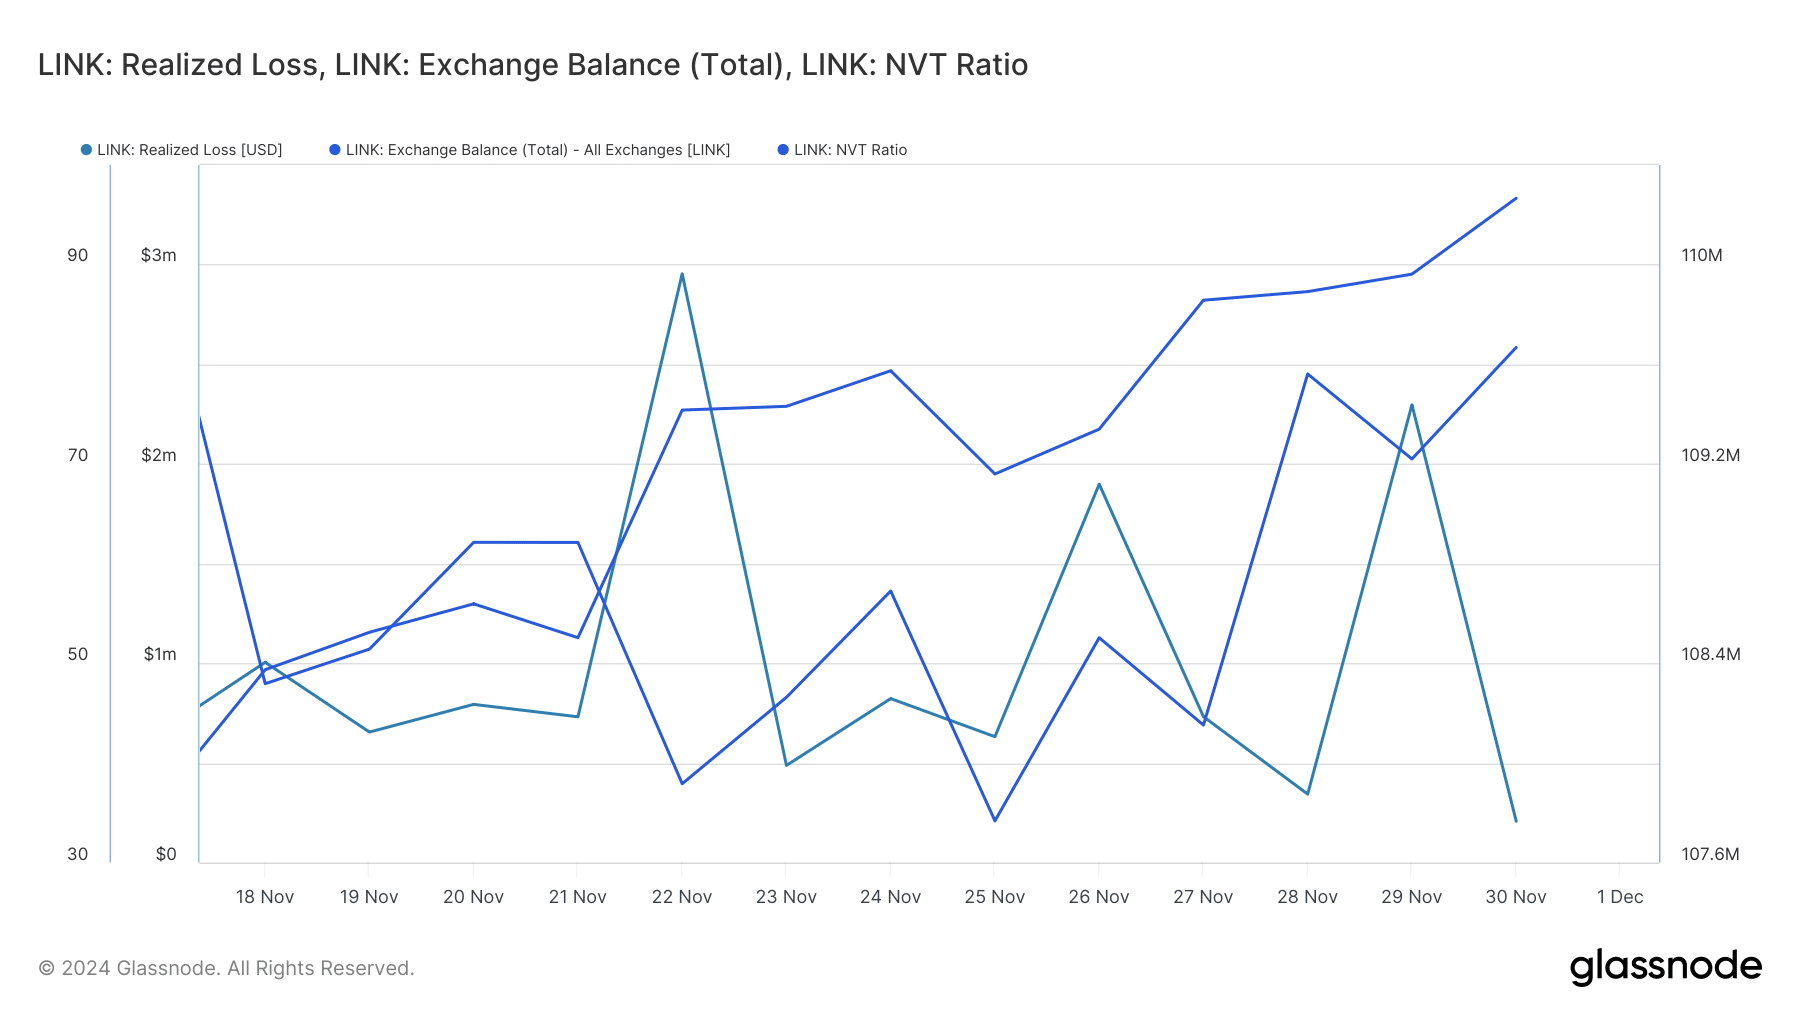
Notably, LINK’s exchange balance increased sharply, meaning the selling pressure on it was rising — an indication of a price correction.
Its NVT ratio also spiked, which typically indicates that an asset is overvalued, further suggesting a pullback. However, investors need not worry, as such price corrections often happen before a flag formation.
Interestingly, while Chainlink’s metrics suggested a price drop, its realized loss declined sharply. This development can be attributed to the token’s past price hikes, which pushed more investors to profit.
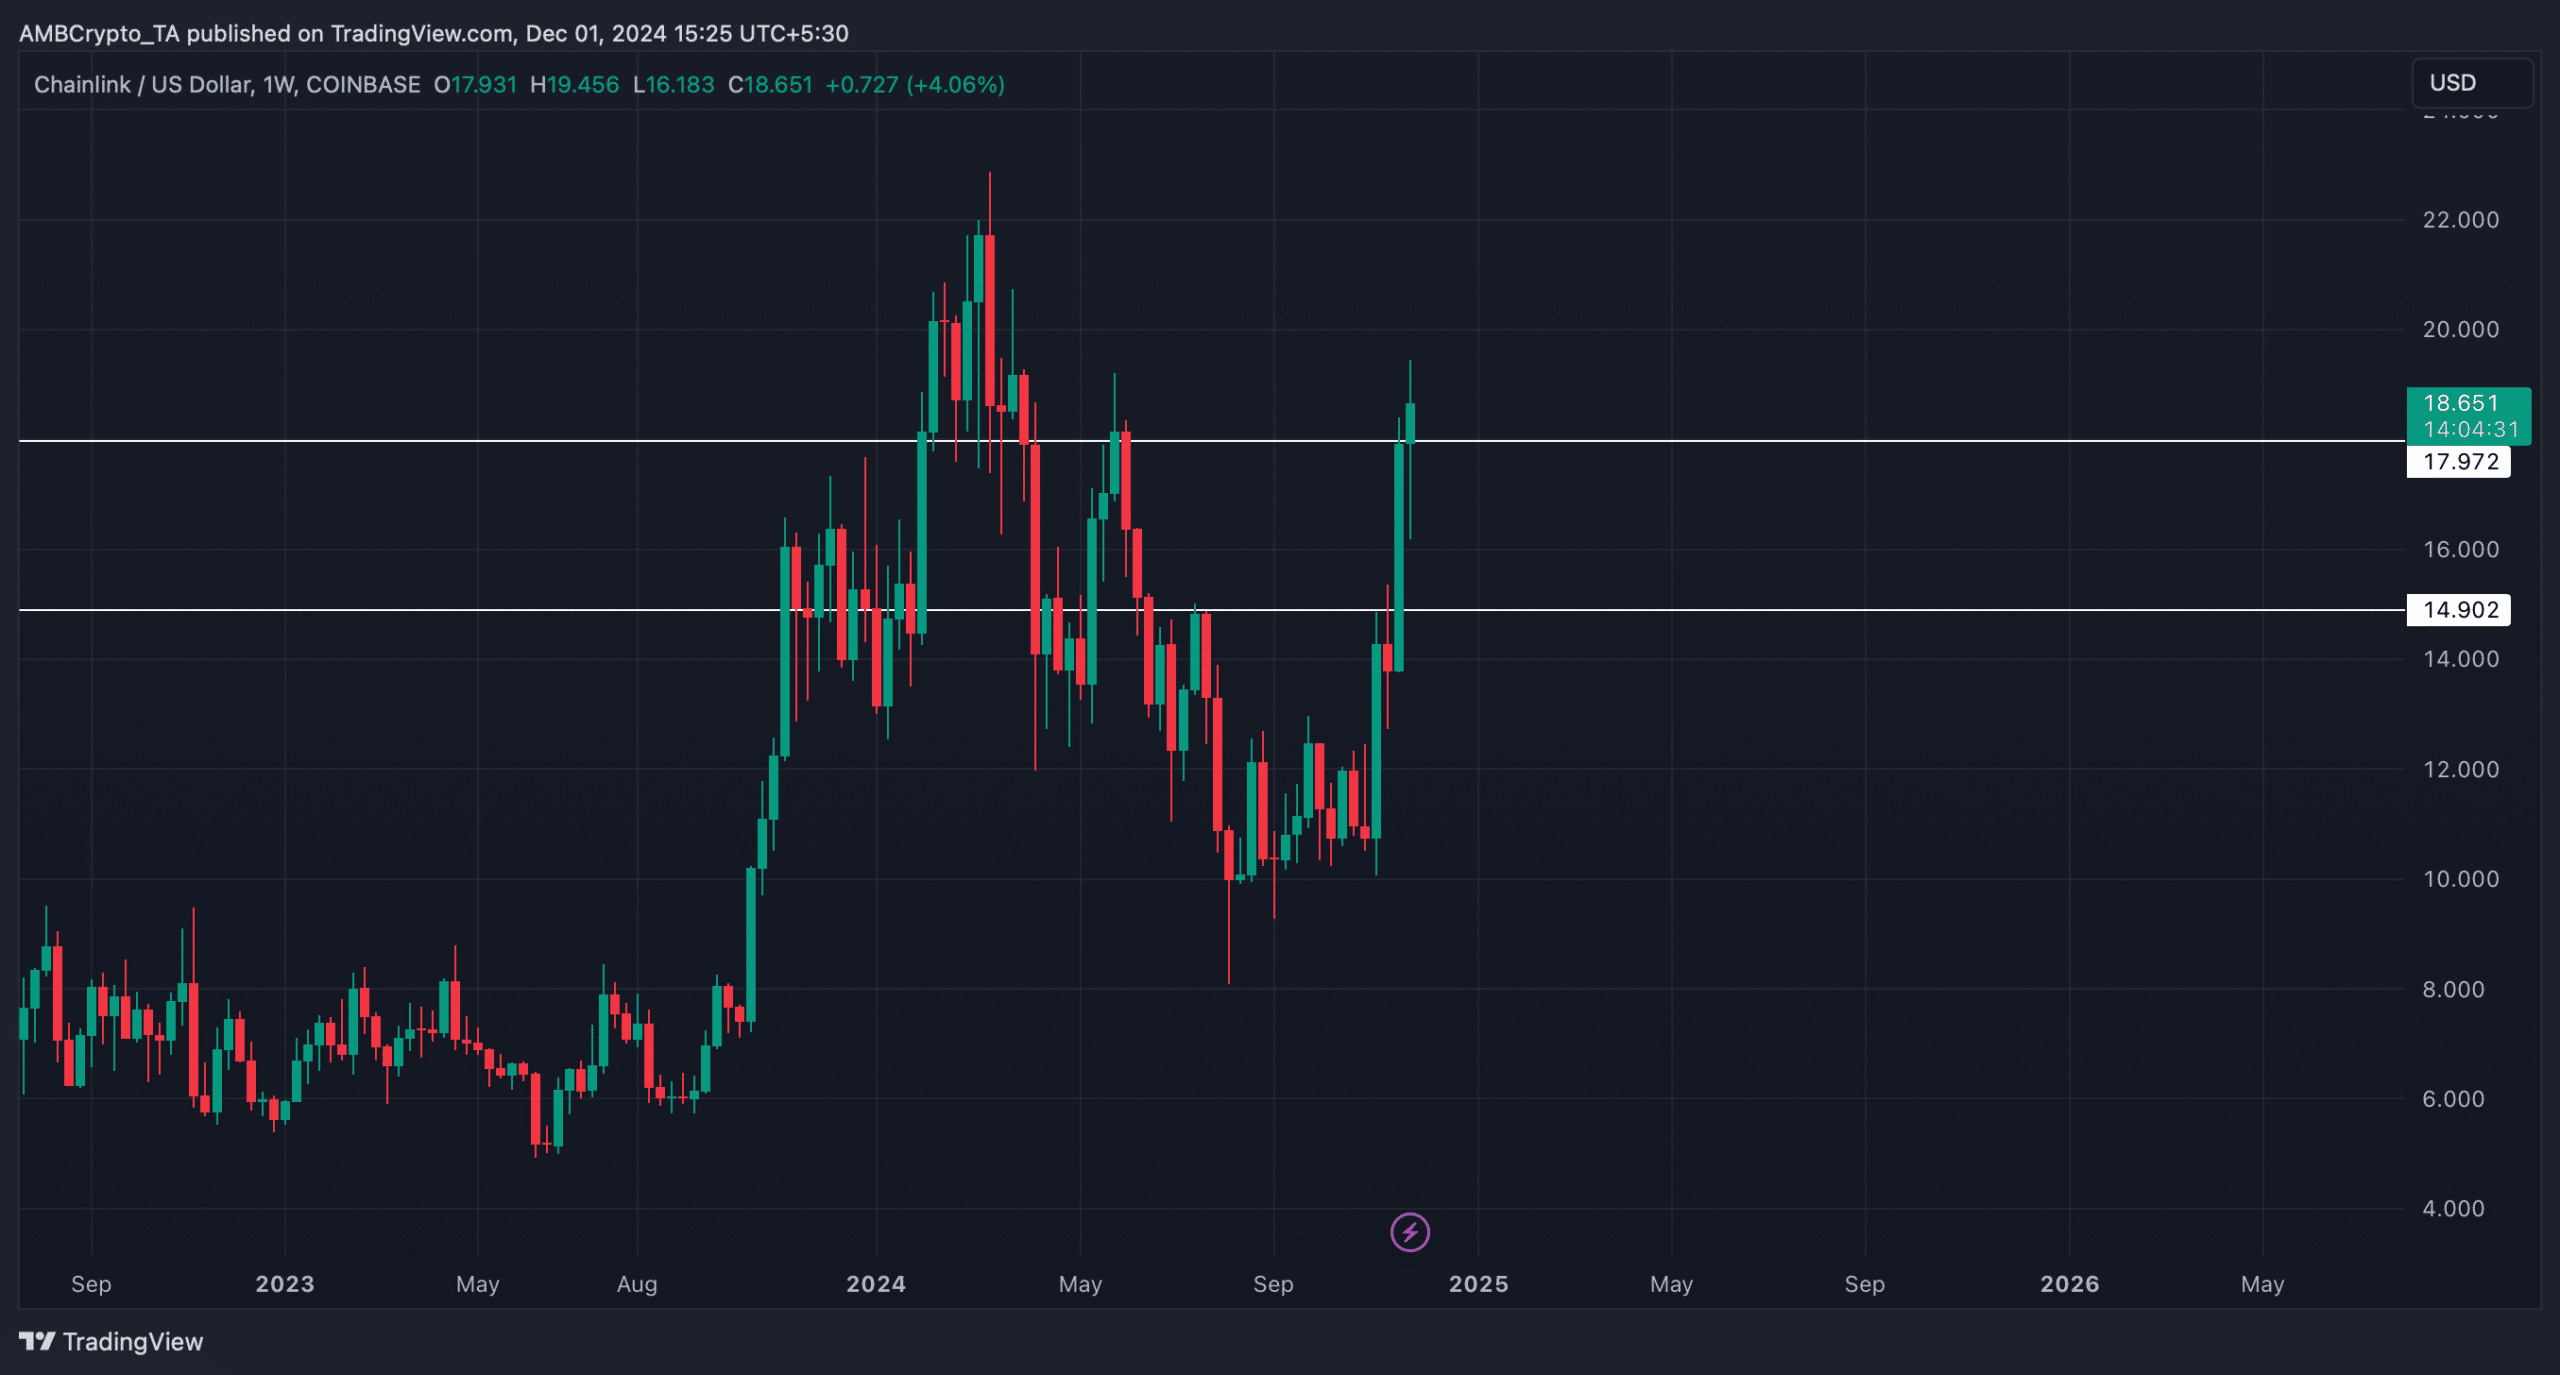
Next, we checked the token’s daily chart to look for short-term support and resistance zones. We found that at the time of writing, Chainlink was testing its support at $18.66.
Is your portfolio green? Check out the LINK Profit Calculator
A successful test could still allow LINK to move up in the coming days.
However, a failed test could push it back to $14.9. In any condition, there were high chances of the token forming a bull flag pattern.


