Will LINK fall in a bull trap, or rally?

Disclaimer: The information presented does not constitute financial, investment, trading, or other types of advice and is solely the writer’s opinion.
- Price bounced off $5 support to ease selling pressure.
- Declining spot CVD highlighted a lack of demand.
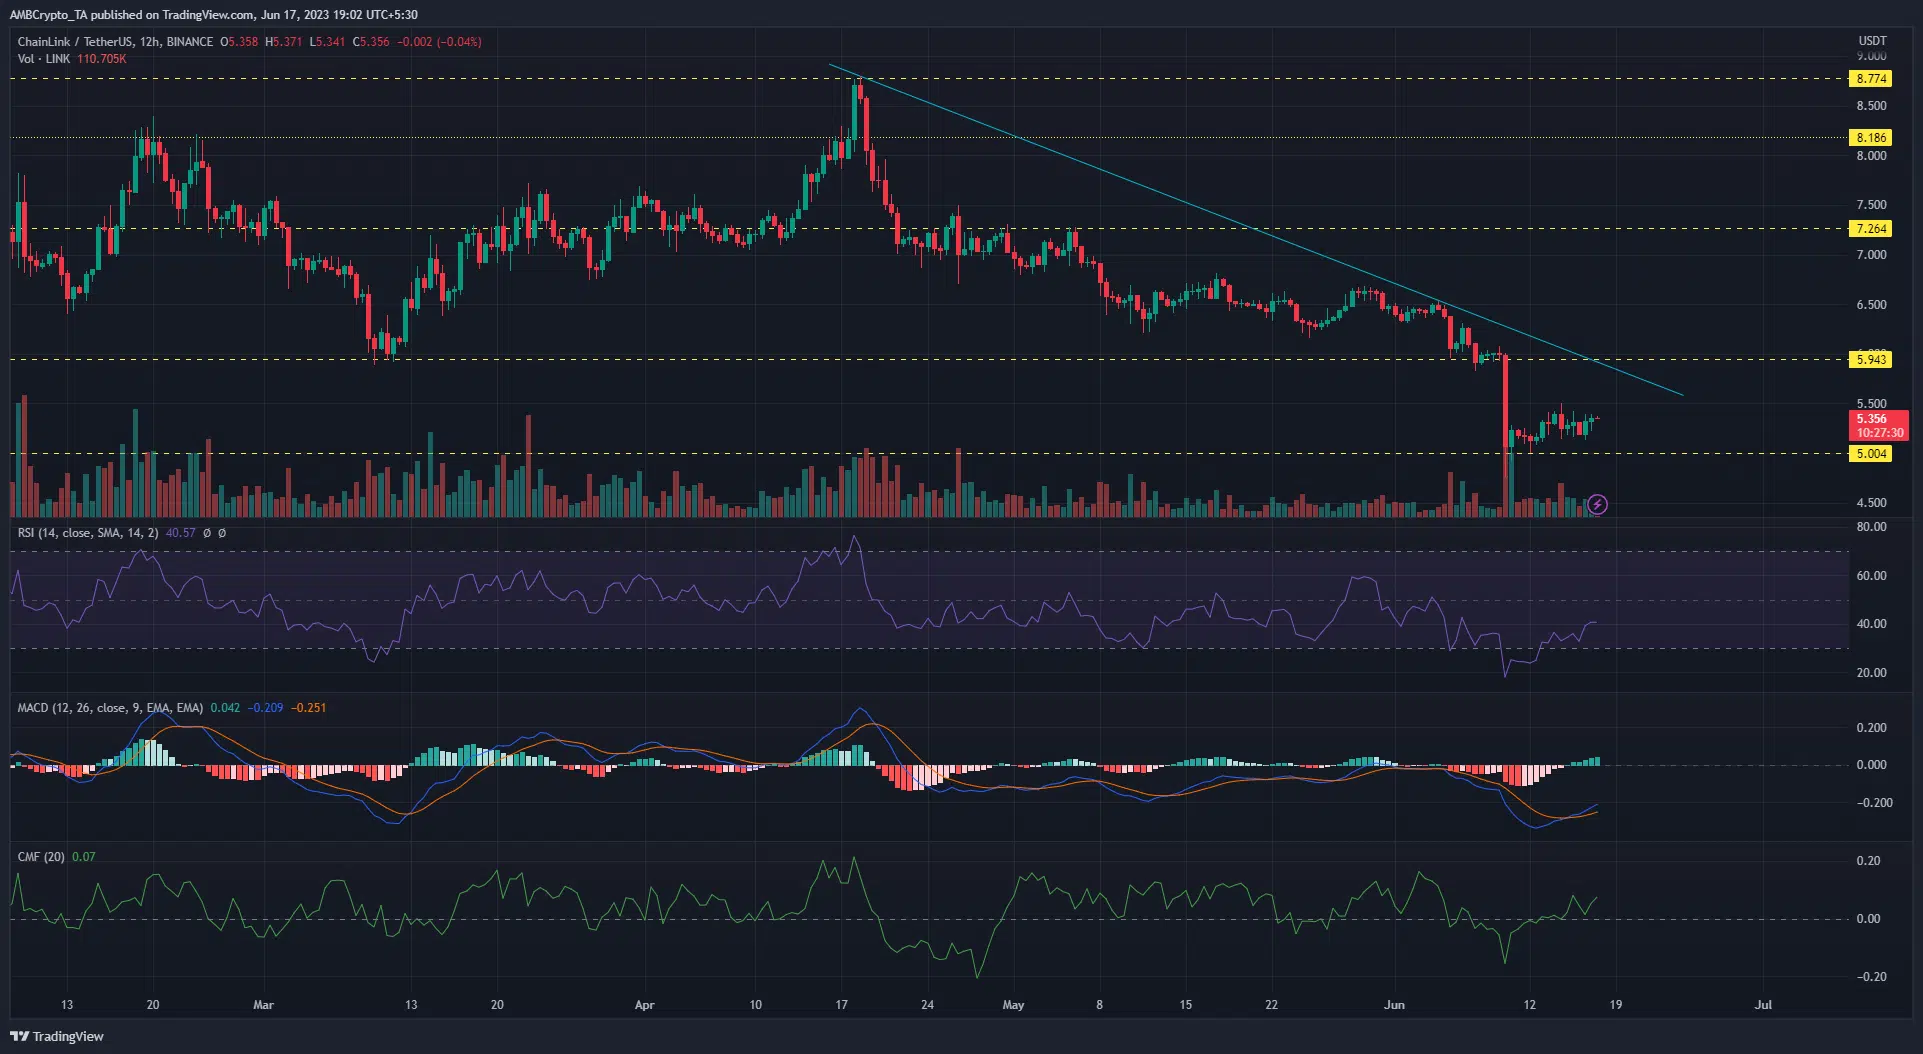
Chainlink’s [LINK] extended bearish swing saw it sink to a two-year low of $5. A recent price report highlighted the altcoin’s vulnerability to more losses due to the intense selling pressure. This was evident in the 20.6% price dip on 10 June, marking a new low for LINK.
Read Chainlink’s [LINK] Price Prediction 2023-24
With the $5 support holding firm over the past seven days and Bitcoin [BTC] rising to $26.5k, buyers could be looking to reverse some of the recent losses for LINK.
Bearish swing temporarily halted at $5 support level
LINK achieved a year-to-date high of $8.77 on 18 April. Nonetheless, that price zone has been a strong area for bears, as occasioned by the massive dip that happened when price last approached that zone in November 2022.
This time was no different, as the price rejection at the $8.77 resistance sent LINK on a massive downward spiral, crashing through the $8.18 and $7.26 support levels. A bullish reaction was expected when LINK descended to the March low of $5.94. Still, bears prevailed to send price crashing to $5.
Bulls showed signs of life with 3.9% gains over the past 24 hours. However, much more will be needed to break the bearish structure with major hurdles lying at the bearish trendline and resistance confluence ($5.50 – $6).
On–chart indicators flashed promising signals on the 12-hour timeframe. The MACD posted a bullish crossover along with green bars above the zero mark. The CMF remained above the zero mark with a reading of +0.07 while the RSI crawled out of the oversold zone and stood at 40, as of press time.
These pointed to bulls experiencing a respite from the selling wave in the short/mid-term.
Realistic or not, here’s LINK’s market cap in BTC’s terms
Market speculators not moved by recent gains

Source: Coinalyze
A look at LINK’s on-chain metrics highlighted the lack of interest in a bullish rally. The spot CVD remained in a steady decline. This hinted at a lack of demand for LINK. Conversely, the Funding Rate has been negative since 16 June, with investors hesitating to make any moves.
This underscored the strong bearish sentiment still prevalent, which could limit a recovery for LINK in the mid/long term.


