Will Litecoin see a dip to $85 before its next push higher?

Disclaimer: The information presented does not constitute financial, investment, trading, or other types of advice and is solely the writer’s opinion.
- The daily timeframe remained bullish, but a pullback could occur.
- On-chain metrics and a positive funding rate also highlighted bullish expectations.
Litecoin retested the bullish order block at $81.6 and bounced to trade at $88.6 at the time of writing. More gains are expected, and the zone of resistance at $104 can be reached soon. On lower timeframes, momentum flipped bearishly and indicated a small pullback can occur.
Read Litecoin’s Price Prediction 2023-24
Bitcoin has pushed higher to the $23.3k mark in recent hours of trading. The king also has a bullish bias, and until this changes, traders can expect altcoins to perform well.
Inefficiency has been filled and LTC looks to push higher after retesting the order block
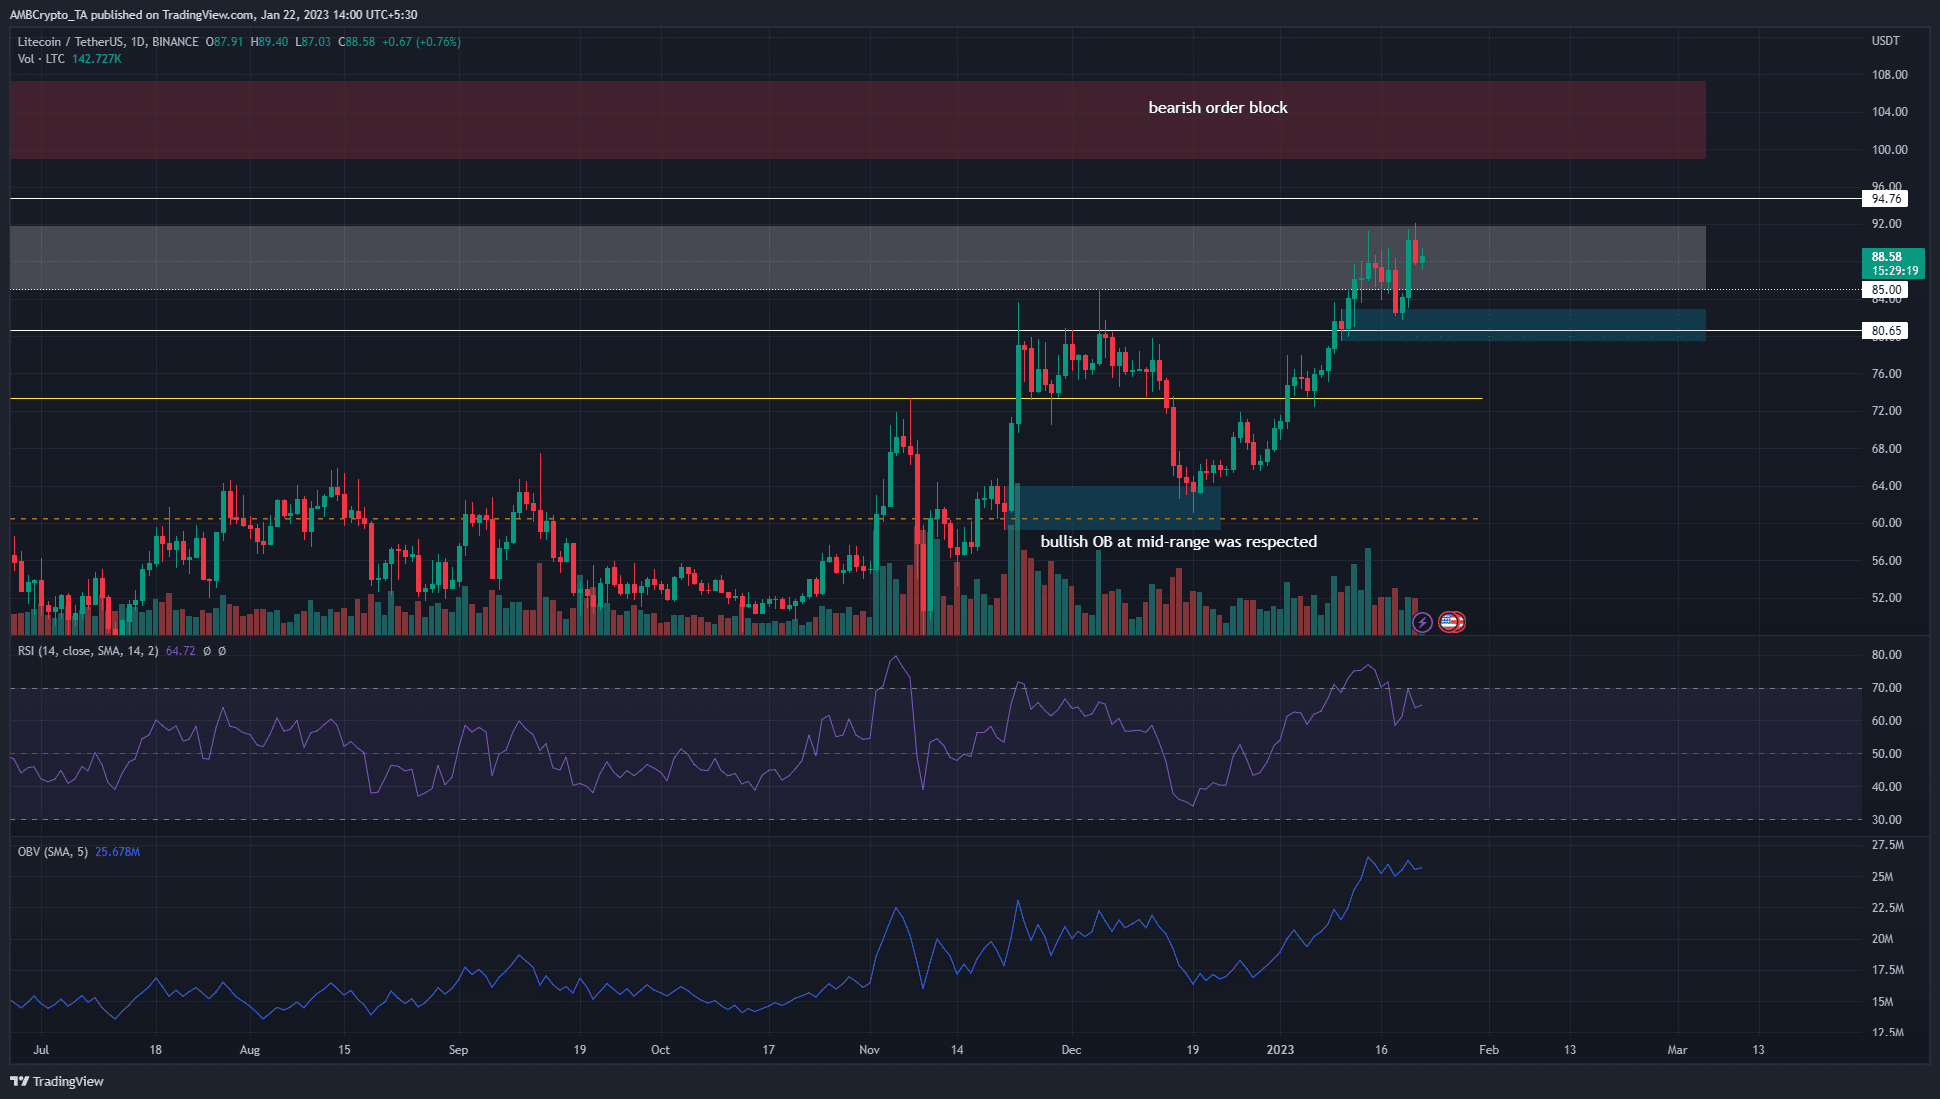
The bullish order block on the daily timeframe formed on January 10, as the dip to $85 was followed by a swift move to $90.5. This signaled the bulls were strong in the vicinity of $85. This was proved once more recently.
A pullback from the $90 mark met with support at $81.6. A horizontal level of support at $80.65 was also present below and served to signal the strength of bulls in this region. Since this retest, Litecoin has noted gains of close to 8% at the time of writing.
Realistic or not, here’s LTC’s market cap in BTC’s terms
Lower timeframe charts such as the 1-hour showed a bearish market structure. This by itself was not sufficient to suggest a pullback to $85. To the north, the next major resistance lies at $93-$94. The $99-$107 also has a bearish order block. A retest of this area was likely given the strong bullish momentum and spot demand Litecoin saw in recent weeks.
The OBV underlined buying pressure as it formed higher lows since December 19. Meanwhile, the RSI formed a bearish divergence, but this need not play out immediately.
The mean coin age showed an accumulation trend but the positive MVRV could see holders take profit soon
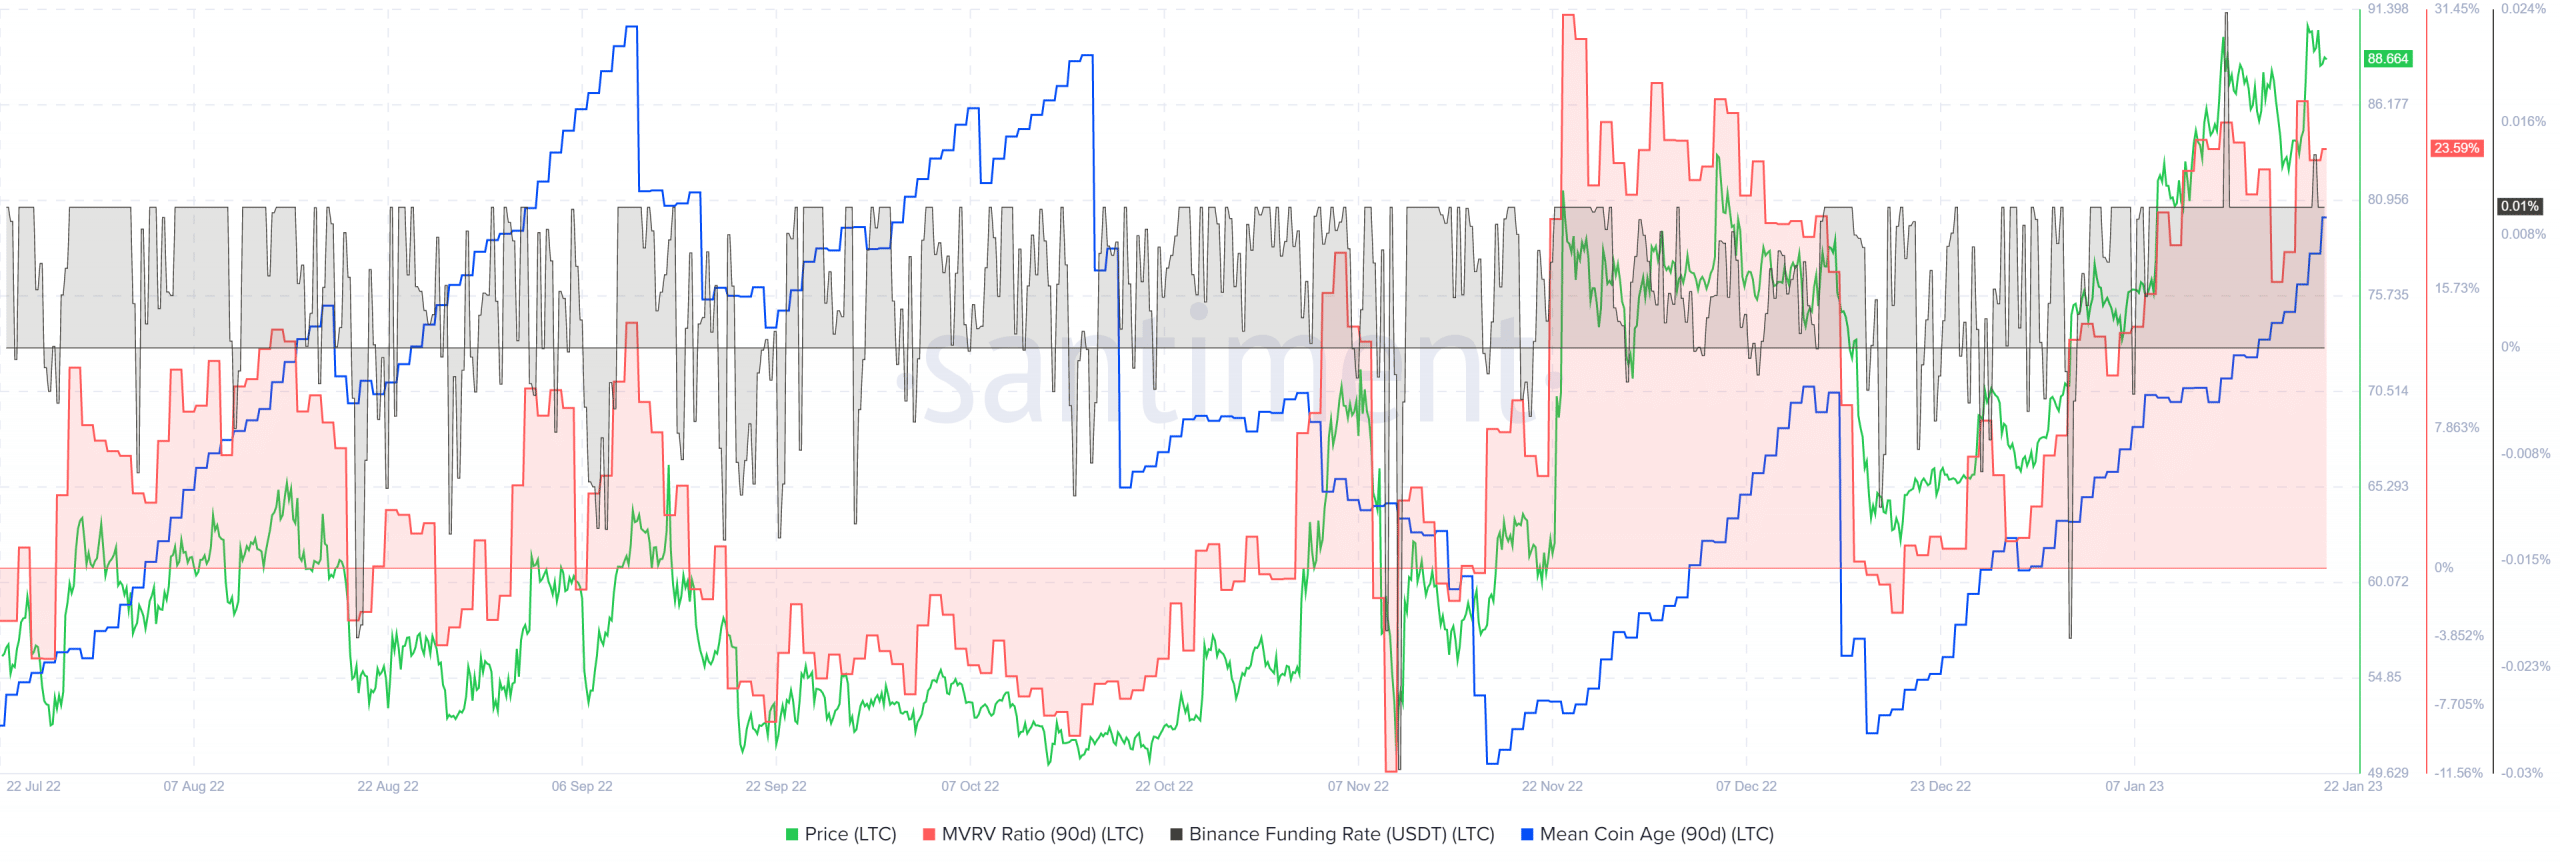
The Binance funding rate was positive, which showed futures market participants continued to expect gains. The 90-day mean coin age has also been on the rise since mid-December. This signaled an accumulation phase.
The positive MVRV was close to levels it had been in late November when the price dropped from $80 to $65. Could another such drop follow?