Will Polkadot [DOT] be subjected to sharp sell-off coming week

Disclaimer: The findings of the following analysis are the sole opinions of the writer and should not be considered investment advice.
Bitcoin [BTC] fell by nearly 7% in recent hours of trading and had a bearish short-term outlook yet again. Many altcoins also followed and posted double-digit percentage losses over the previous day of trading alone.
Polkadot [DOT] was one of these coins. The coin was able to climb to the $7.7 mark on the back of steady demand. However, the buyers quickly turned into sellers as fear gripped the market yet again.
DOT- 1-Hour Chart
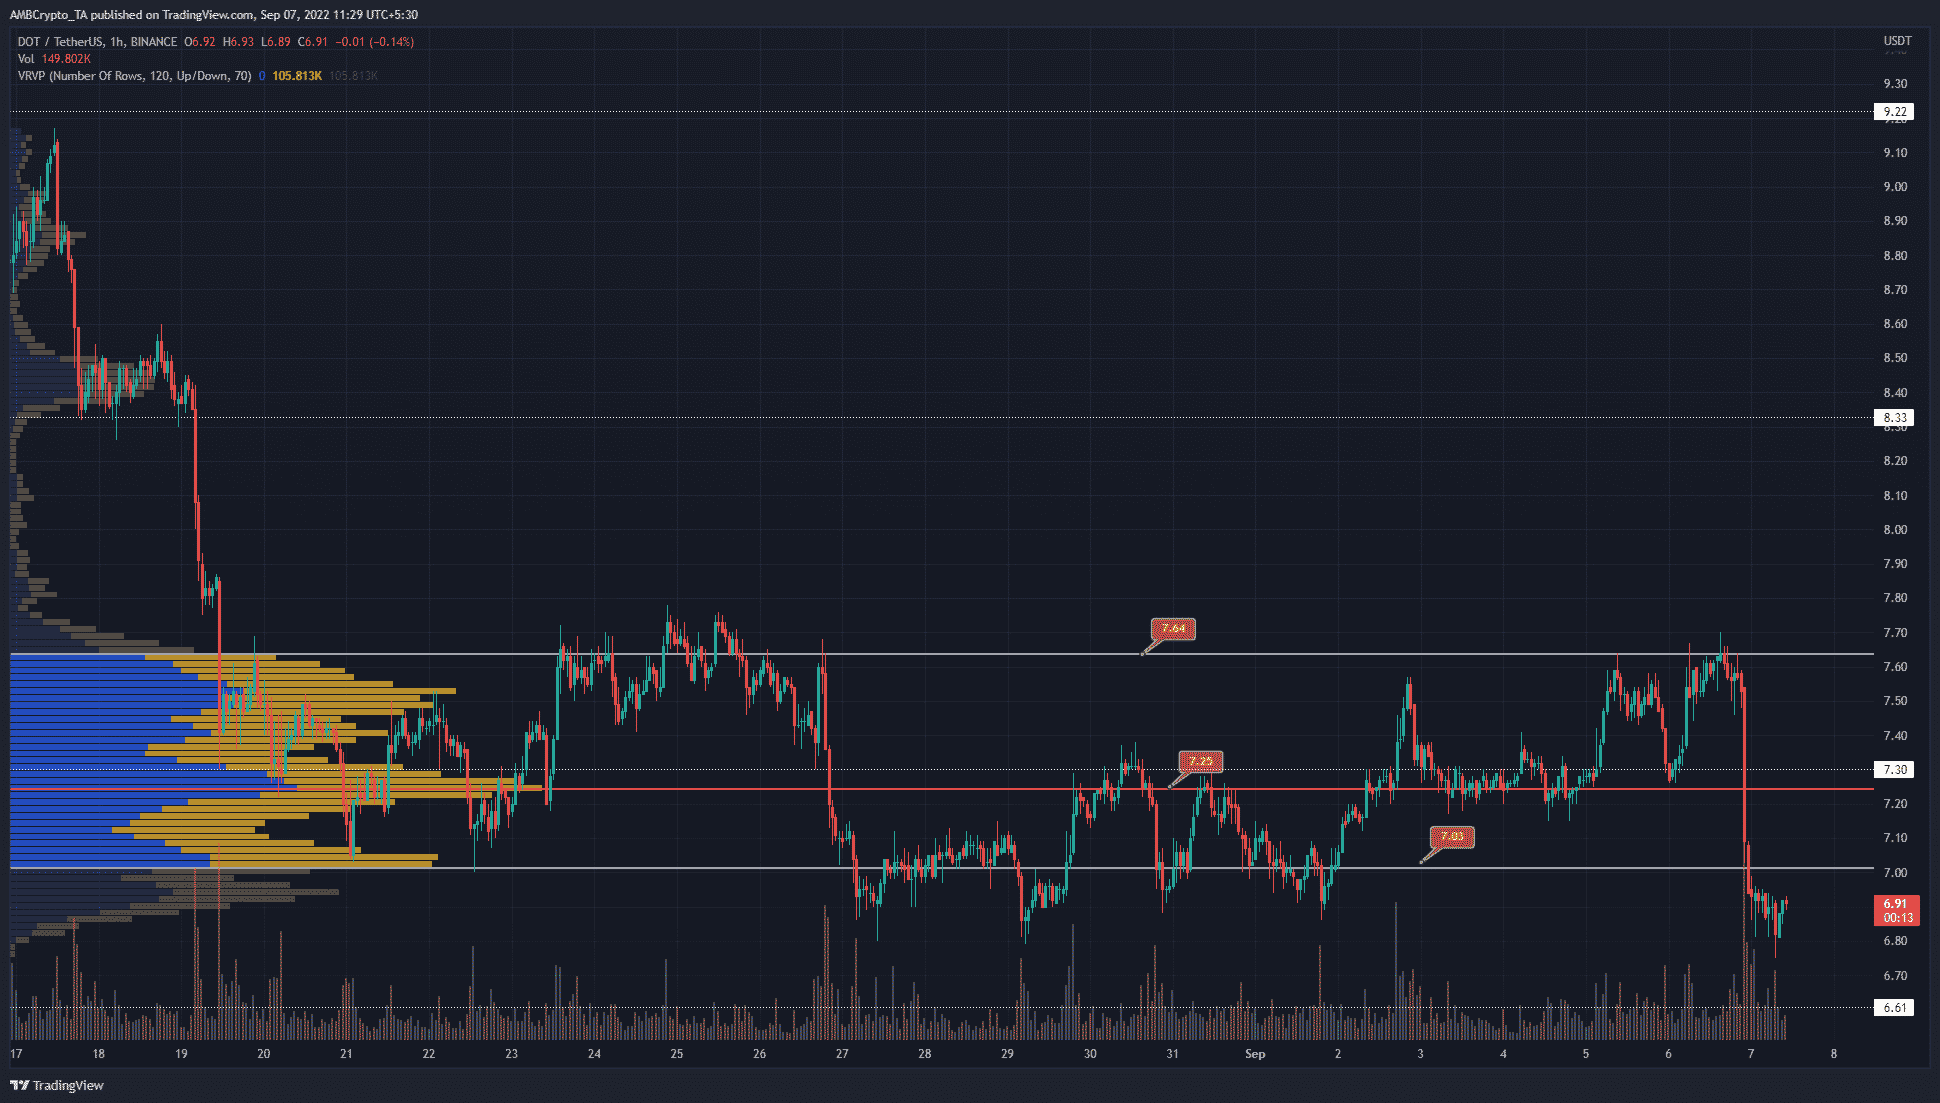
Polkadot has traded within the $7.7 and $6.9 area for most of the past two weeks. The Volumpe Profile Visible Range tool showed the Point of Control to lie at $7.25. This was the point at which the most trading volume was witnessed over the visible range. It marked a significant level of support, one that DOT smashed past the previous day.
The Value Area Low (VAL) and High lay at $7.03 and $7.64. At the time of writing, the price was beneath the VAL. The VAL represented a decent buying opportunity, but the dip beneath $7 meant that long positions might be unsafe.
A revisit to the $7 and $7.3 could occur as the price searches for liquidity. However, the $7.25-$7.3 belt would likely pose far too much resistance for DOT to be able to break past on its first couple of tries.
Rationale
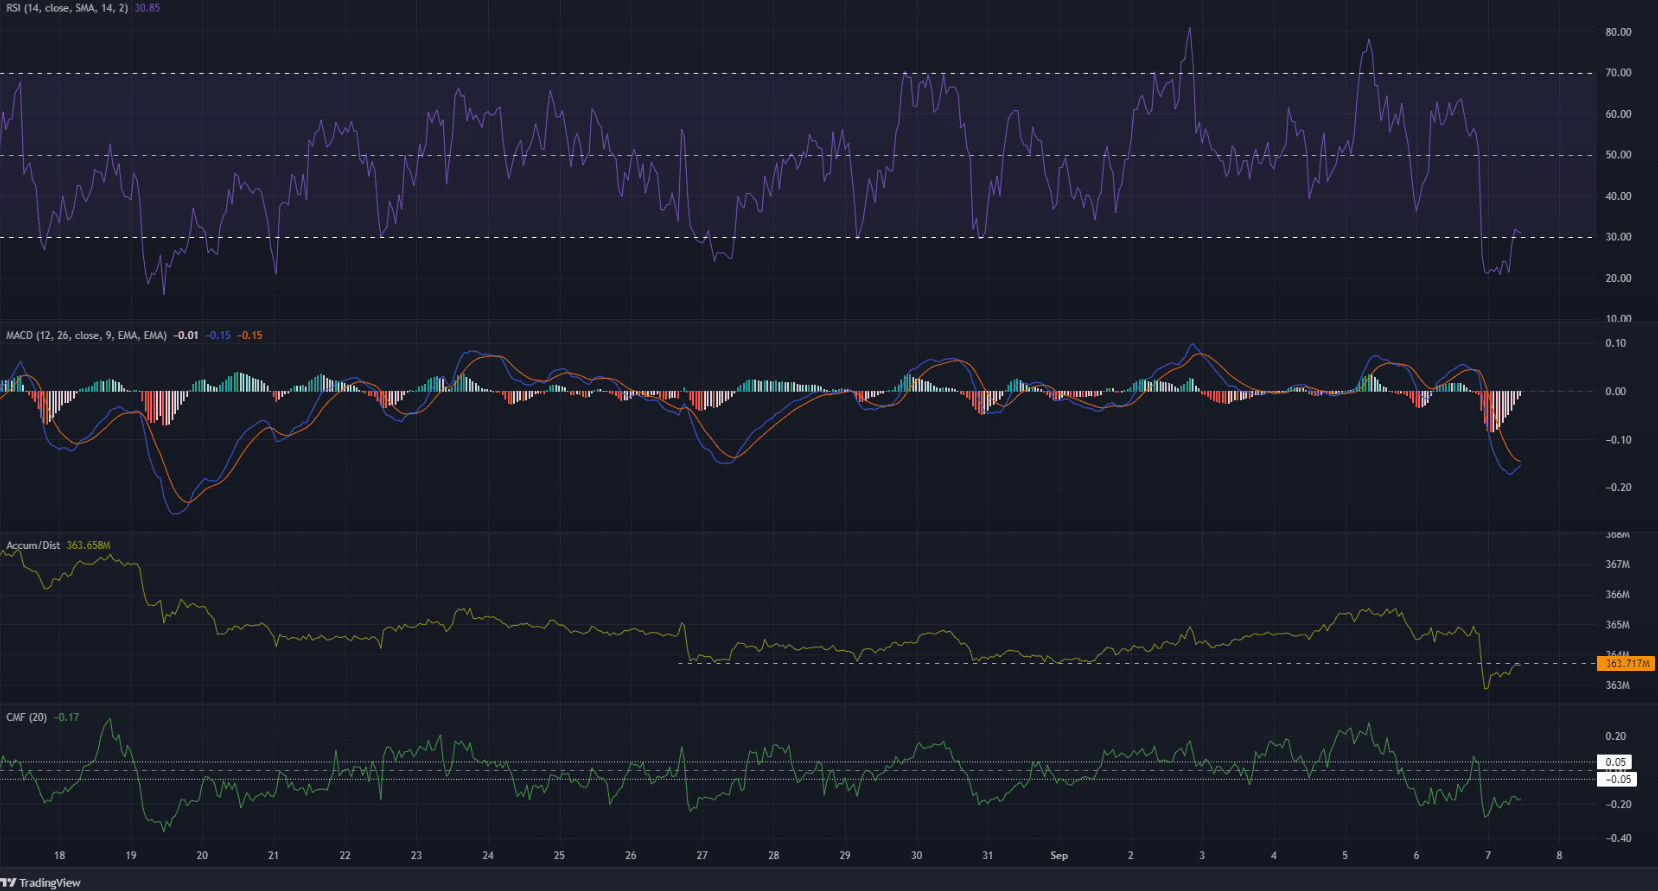
The Relative Strength Index (RSI) dropped from 60 to 22 over the course of the previous day’s trading. The Moving Average Convergence Divergence (MACD) also saw a sharp plunge beneath the zero line.
It was pretty straightforward that bearish momentum was dominant in recent hours. But can a relief rally be expected for DOT?
The Accumulation/Distribution (A/D) indicator saw a drop as well and was below a resistance level from last week. A rejection at this level could be a precursor to further losses. The Chaikin Money Flow (CMF) also hinted at a bearish bias. It was firmly below the -0.05 mark to indicate significant selling pressure.
Conclusion
The price would need to flip $7.3 to support before a bullish short-term bias can be justified. The volume indicators would also need to climb past their respective resistance levels. It appeared more likely that a move to $7.25-$7.3 would offer a selling opportunity than a buying one.


