Analysis

Will Polkadot’s strong short-term advance boost its climb to these levels
Posted:
Journalist

Bitcoin’s recent bullish momentum saw most of the market register gains. Polkadot was no exception. It has, in fact, performed very well. Polkadot gained an impressive 28% in a period of four days, to reach the key level at $29.8. At the time of writing, it saw a pullback to $28.27.
DOT — 1-hour chart
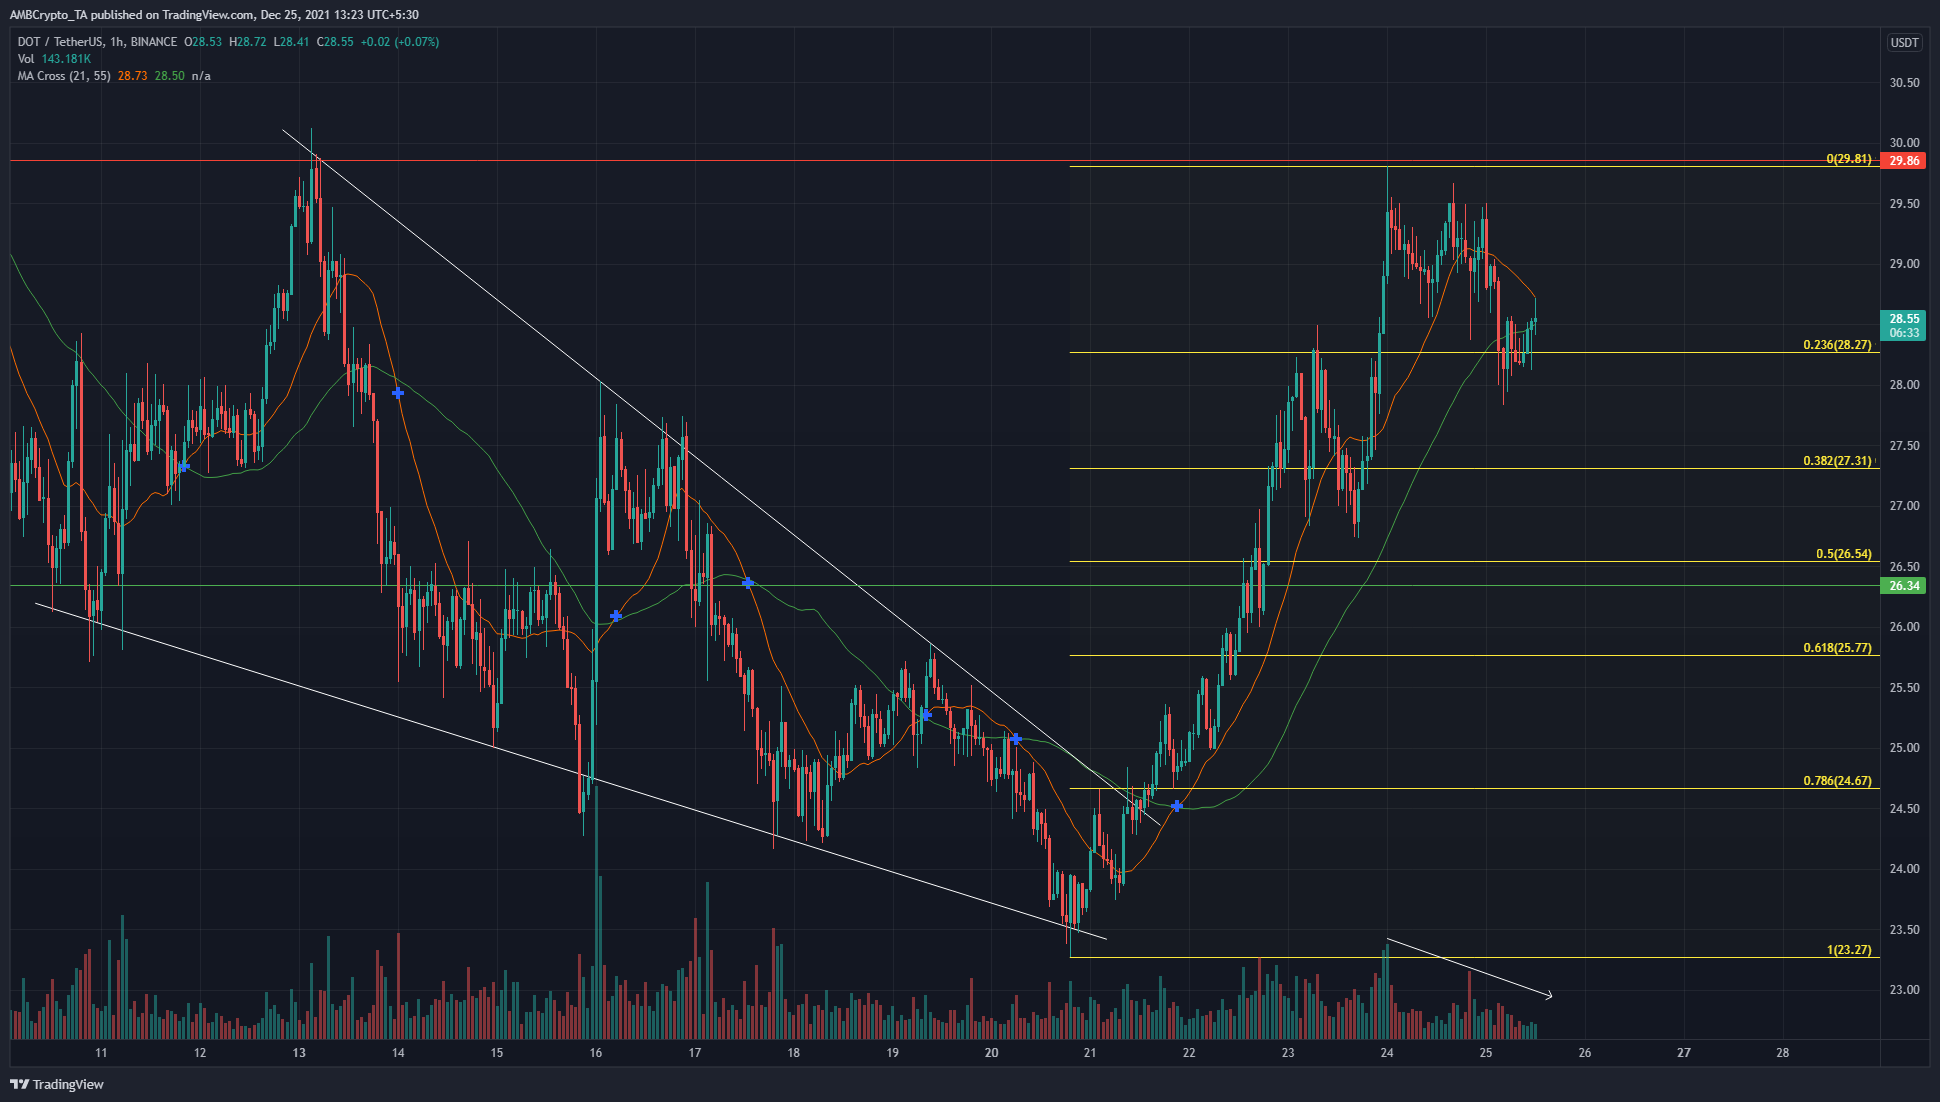
Source: DOT/USDT on TradingView
DOT formed a descending wedge pattern (white), over the past two weeks and broke out a few days ago. It climbed steadily and rapidly to the $29.81 level. A higher timeframe level of resistance was also present in the vicinity, at $29.86.
Using the Fibonacci retracement tool for DOT’s surge from $23.27 to $29.81, we find that the price has seen a pullback to $28.27 already, which was the 23.6% retracement level.
The $28-$28.4 area has also been an area of liquidity in recent weeks, and it was an encouraging sign of strength from bulls that they were able to buy the pullback to this area.
Although not shown on the chart, the 27.2% and 61.8% extension levels for DOT’s breakout lie at $31.59 and $33.85. Generally, these extension levels are areas where the move halts, at least temporarily.
Rationale
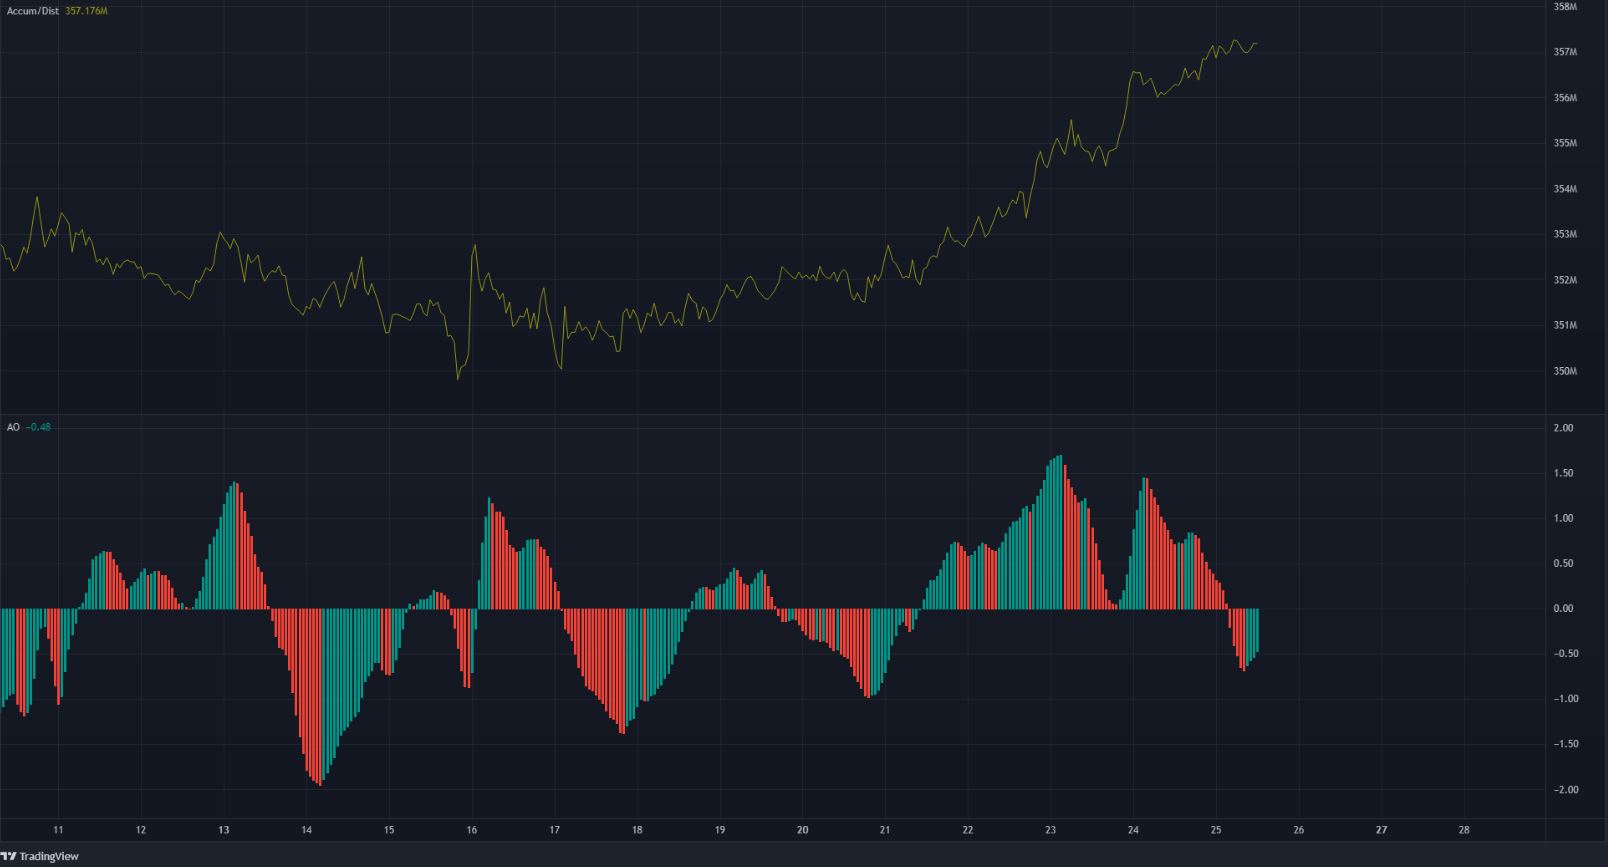
Source: DOT/USDT on TradingView
The A/D line advanced in recent days to form higher lows. This showed that buying volume has outweighed the selling volume over the past few days.
The Awesome Oscillator fell below the zero line during the pullback from $29.8 to $28.2. We can’t read too much into this and as this is the 1-hour time frame. The 21-period SMA (orange) continued to stay above the 55 SMA (green) on the price chart.
Another thing to note on the price charts was that the pullback that occurred on decreasing volume. This meant that the pullback was likely to be only a pullback and would be followed by another move higher. There was a concern that, following the $27.8 retest, trading volume had not increased. This was a suggestion that a deeper pullback could yet be seen.
Conclusion
The 23.6% level looked to have halted the pullback, but a revisit to $27-$27.3 can not be ruled out. Based on the evidence at hand, however, it appeared more likely that bulls would continue to push toward the $31.59 and $33.85 levels. $30 was likely to be a round number resistance on the way, and a candle close above this level would encourage buyers further.