
- SAND’s Open Interest jumped by 5.6% in the past 24 hours following a bullish breakout.
- The major liquidation levels were at $0.255 and $0.27, with traders over-leveraged at these levels.
The overall cryptocurrency market is experiencing a notable recovery.
Amid this, the virtual gaming platform The Sandbox [SAND] has broken out of a strong bullish pattern and shifted the sentiment from a downtrend to an uptrend.
SAND technical analysis and key levels
According to AMBCrypto’s technical analysis, SAND appeared bullish at press time as it broke out of a double-bottom price action pattern. The breakout was confirmed by the daily candle closing above the neckline.
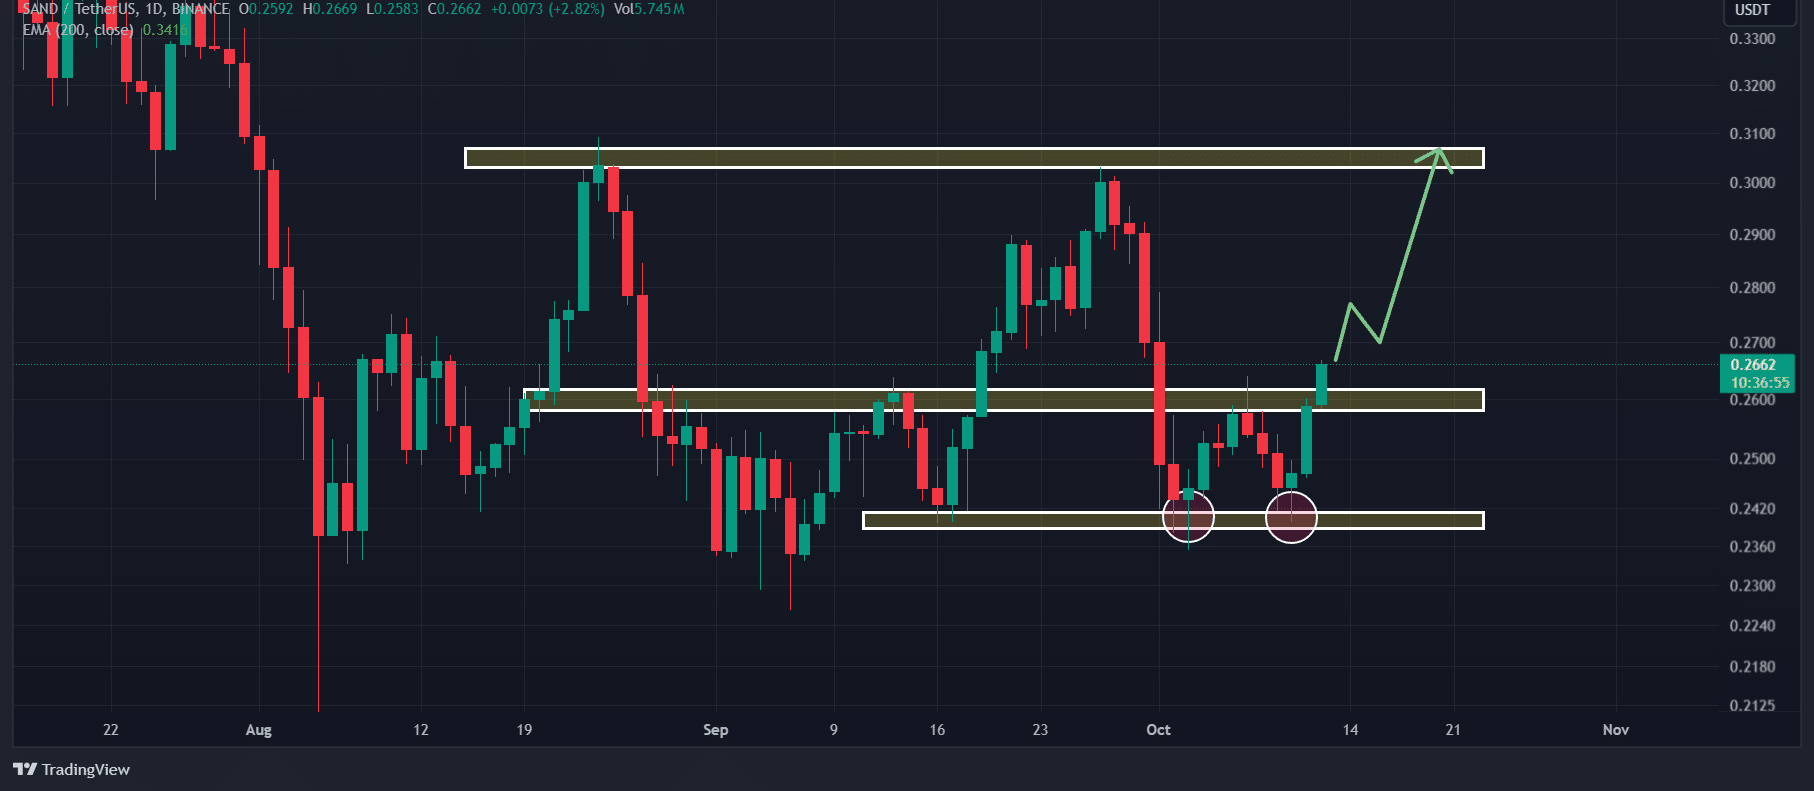
Source: TradingView
Based on the recent price performance, if SAND closes a daily candle above $0.264, there is a strong possibility it could soar by 15% to reach the $0.305 level in the coming days.
Additionally, SAND’s Relative Strength Index (RSI) stood at 52.30 at press time, hinting at a potential upside rally ahead.
Despite SAND’s bullish outlooks, the 200 Exponential Moving Average (EMA) indicated a downtrend. When an asset trades below the 200 EMA, traders and investors generally consider it to be in a downtrend, and vice versa.
SAND’s bullish on-chain metrics
SAND’s bullish outlook is further supported by on-chain metrics. According to the on-chain analytics firm Coinglass, SAND’s Long/Short Ratio was 1.03 at press time, indicating bullish market sentiment.
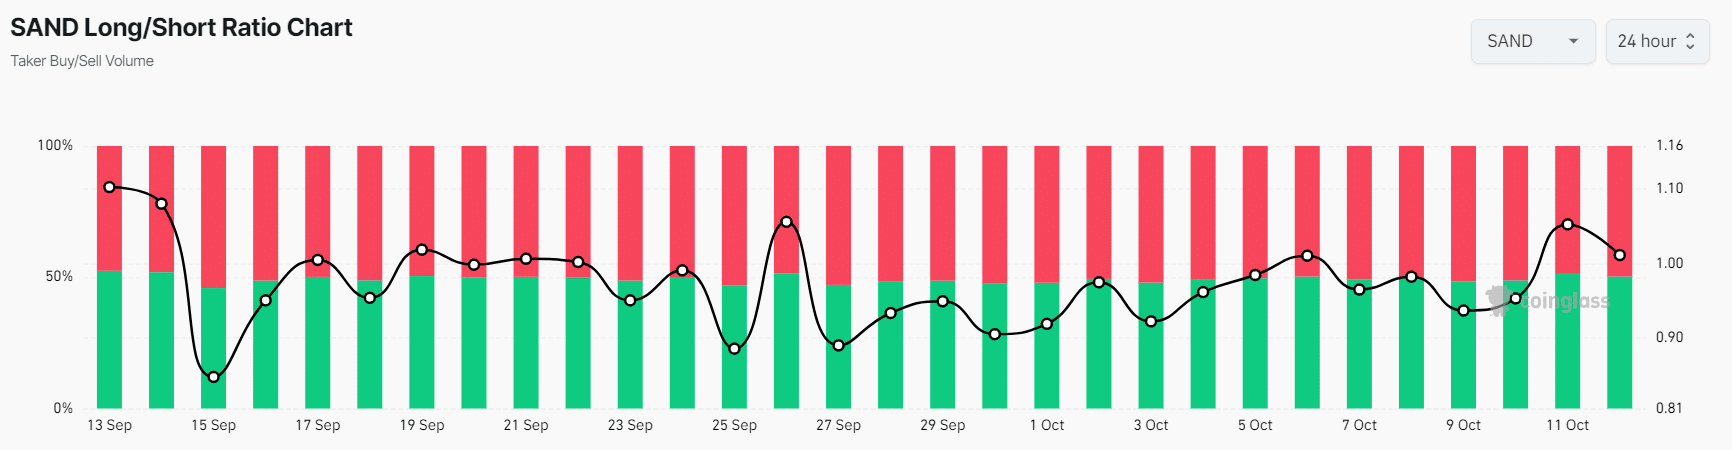
Source: Coinglass
Additionally, its Futures Open Interest jumped by 5.6% in the past 24 hours and 3.91% over the past four hours.
This suggested growing traders’ interest in the SAND token following the breakout of the double-bottom price action pattern.
Major liquidation levels
As of now, the major liquidation levels are at $0.255 on the lower side and $0.27 on the upper side, with traders over-leveraged at these levels, according to Coinglass.
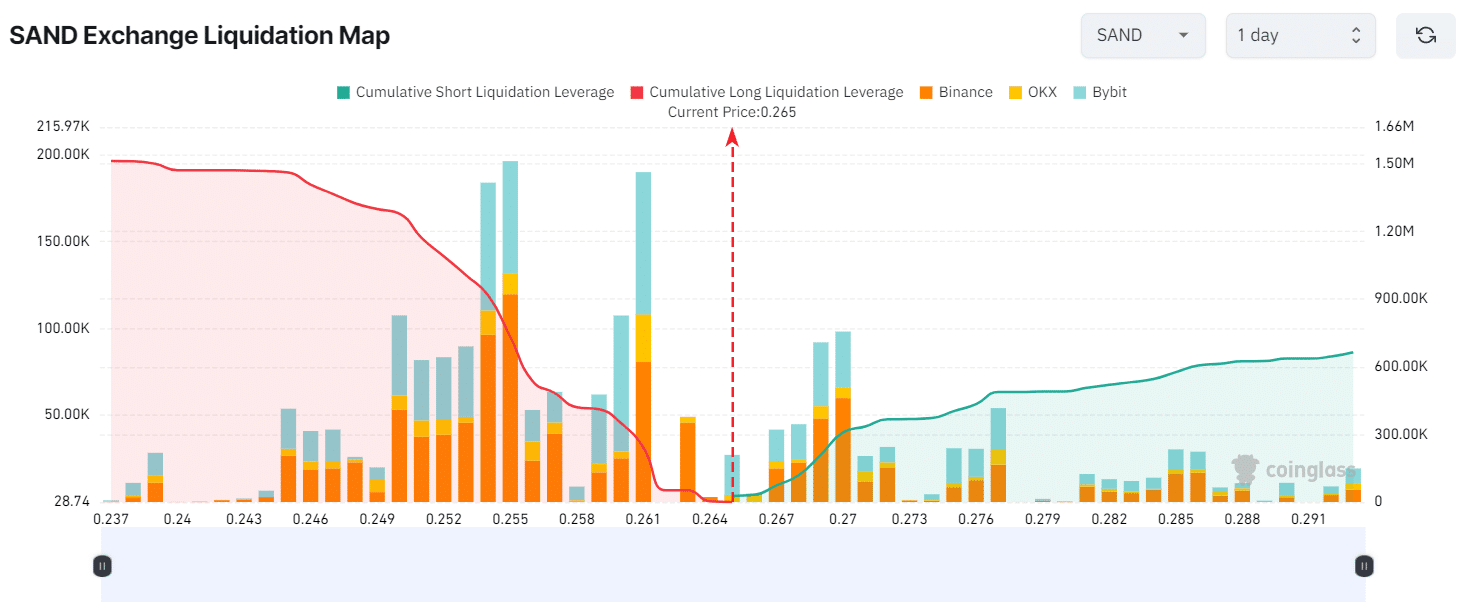
Source: Coinglass
If the market sentiment remains unchanged and the price rises to the $0.27 level, nearly $308,620 worth of short positions will be liquidated.
Conversely, if the sentiment shifts and the price falls to the $0.255 level, approximately $732,960 worth of long positions will be liquidated.
This liquidation data shows, that bulls’ long positions are more than double of bears’ short positions.
Combining all these on-chain metrics with technical analysis, it appears that bulls are currently dominating the asset and have the potential to support SAND in the forthcoming upside rally.
Read The Sandbox’s [SAND] Price Prediction 2024–2025
Current price momentum
At press time, SAND is trading near $0.266 and has experienced a price surge of over 5.2% in the past 24 hours.
During the same period, its trading volume declined by 6%, indicating lower participation from traders and investors.