Will Solana fall below $100, or will a key level save the day?
Solana climbed above $150 on Sunday, but bears emerged soon thereafter, pushing prices to $100.
- The bulls ceded the $150 level to the bears recently as selling pressure intensified.
- Further losses appeared likely, and $150-$160 is a firm resistance zone.
Solana [SOL] bulls enjoyed a brief respite on the 14th of April, when prices climbed above the $150 psychological level. The v1.17.31 release could have contributed to the short-term bounce.
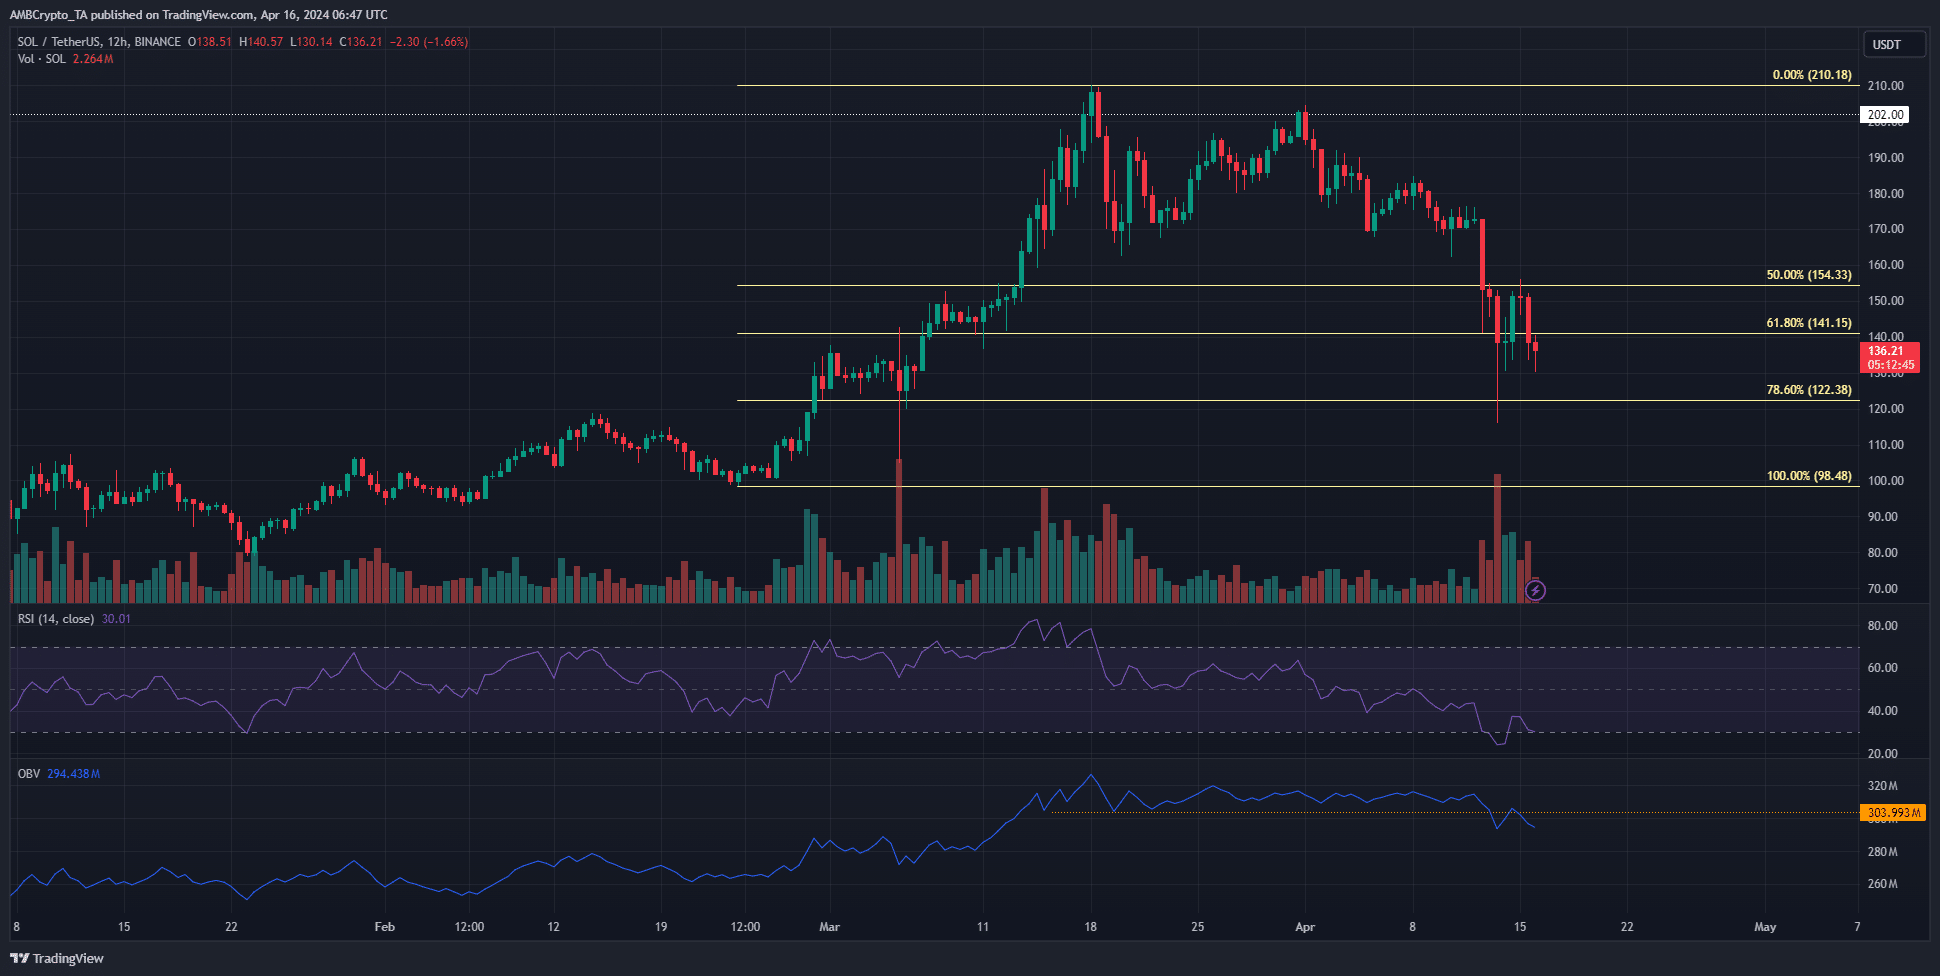
The $155-$162 region was a demand zone that bears have been testing for nearly a month now, but it was broken over the weekend. The Fibonacci levels highlighted that $122 is one level that the bulls must defend.
Solana’s selling volume has gathered strength
On 15th April Solana bounced to reach $156, but this turned out to be a short-term move. The market was too bearishly biased, leading to late bears having their stop-losses hunted during the bounce.
The HTF structure of SOL was still bullish, with $98.48 being the key swing low. A move below this level would flip the 12-hour structure bearishly.
Meanwhile, the lower timeframes already signaled bearishness. Another drop to the $122 level was expected.
The OBV was unable to defend the past month’s support level. This highlighted the bulls succumbing to the selling pressure. The RSI was also well below the neutral 50 mark to highlight firm bearish momentum.
The argument for a sub-$100 Solana
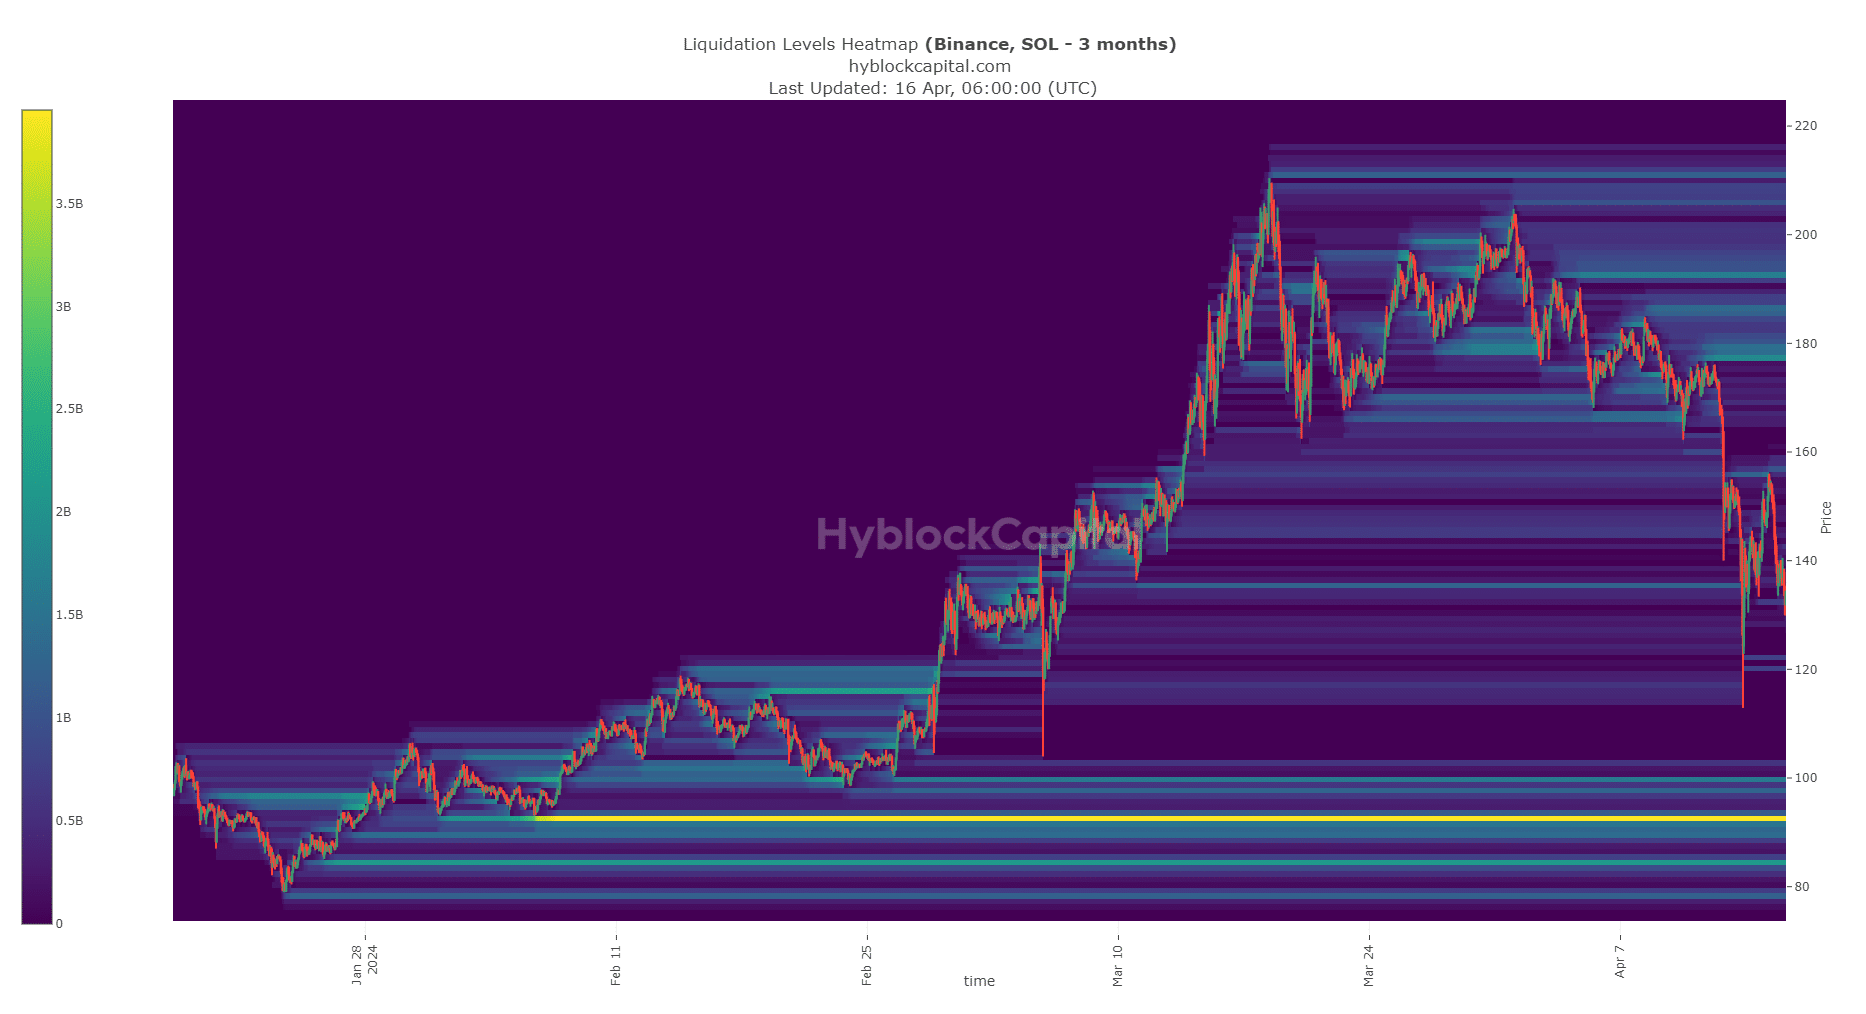
The liquidation heatmap of the past three months showed that the next key area of interest was $92.57. The liquidation levels concentrated at this level have been in place since February.
Is your portfolio green? Check out the SOL Profit Calculator
To the north, the $160 area was also a magnetic zone but of far lesser pull. It was possible that SOL could drop to $92.
However, price need not visit every pocket of liquidity. A 1-day session close below $122 would vastly improve the chances of a drop to $92.57.
Disclaimer: The information presented does not constitute financial, investment, trading, or other types of advice and is solely the writer’s opinion.