Solana
Will Solana fall from $142 to $129? What August holds for SOL
A sell signal flashed on Solana’s chart, which could end up in a price correction towards $129.

- Market sentiment around Solana turned bearish in the last few days.
- But there were chances of the sell signal getting nullified.
Solana’s [SOL] price volatility has dropped over the last week as both its daily and weekly charts were dormant.
But if the latest data is to be considered, a sell signal appeared on SOL’s chart, which might result in a price decline in the coming days. Let’s take a look at what’s going on.
Solana moves a gear down
As per CoinMarketCap’s data, SOL’s price only moved down by 1% in the last seven days.
At the time of writing, SOL was trading at $142.28 with a market capitalization of over $66 billion, making it the fifth-largest crypto.
In the meantime, Ali, a popular crypto analyst, recently posted a tweet highlighting a crucial development. As per the tweet, a sell signal flashed on Solana’s 4-hour chart.
Whenever a sell signal appears, it indicates that there are chances of a price correction.
Therefore, AMBCrypto planned to take a closer look at the token’s state to see whether metrics also hinted at a price drop.
As per our analysis of Santiment’s data, SOL’s Weighted Sentiment dropped sharply, meaning that bearish sentiment around it increased.
As per Coinglass’ data, its long/short ratio also registered a sharp decline. This meant that there were more short positions in the market than long positions, which was bearish.
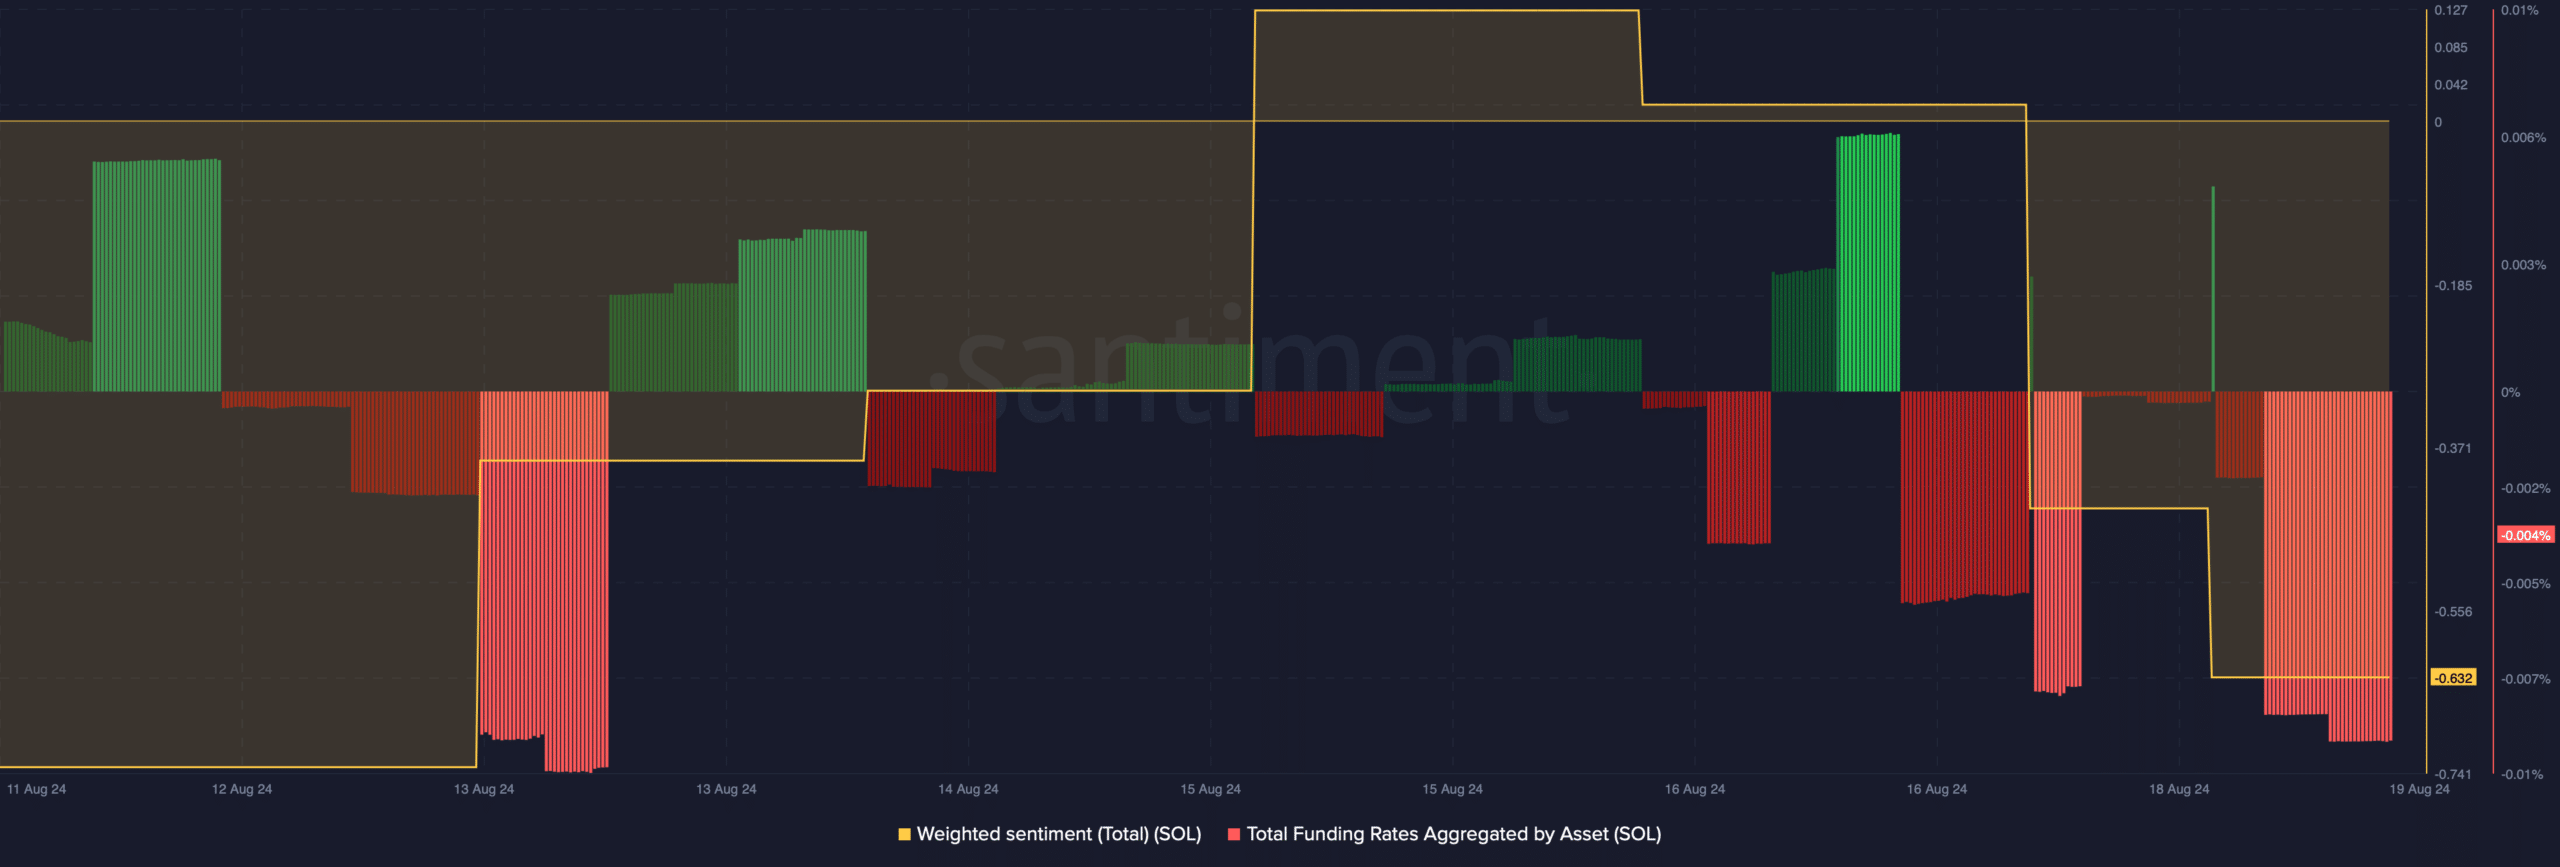
Source: Santiment
Nonetheless, not everything looked bearish, as Solana’s Funding Rate dipped. Generally, prices tend to move in the other direction than the Funding Rate.
Also, at the time of writing, SOL’s Fear and Greed Index had a value of 38%, meaning that the market was in a “fear” phase.
The index hitting this level suggests the possibility of a price rise. AMBCrypto had earlier reported that selling pressure on Solana was low, which can be inferred as a bullish signal.
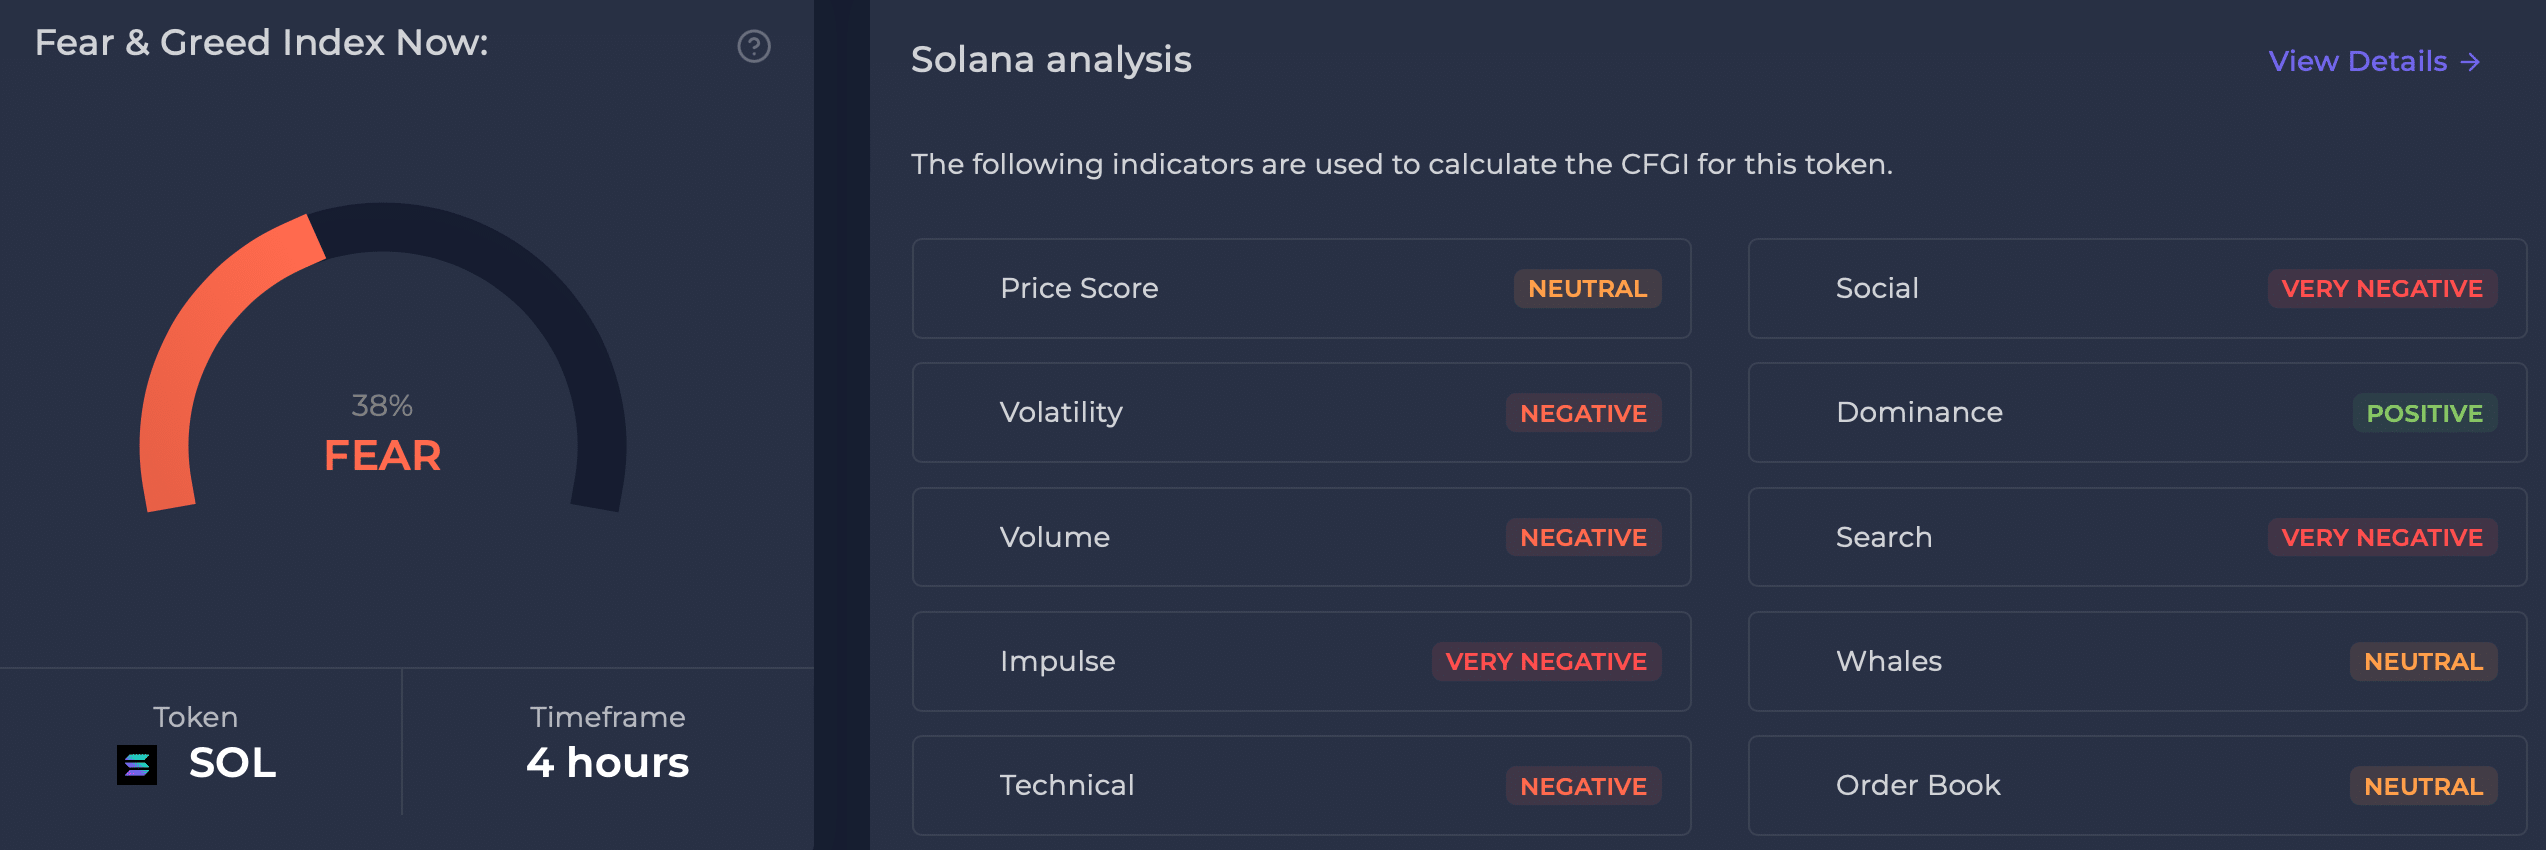
Source: CFGI.io
Solana’s upcoming targets
AMBCrypto then took a look at Solana’s daily chart to find out what market indicators suggested. The Bollinger Bands revealed that SOL was testing its 20-day simple moving average (SMA).
Read Solana’s [SOL] Price Prediction 2024-25
The MACD displayed the chances of a bullish crossover. If that happens, then SOL might successfully go above its 20-day SMA.
This might allow SOL to first target $163 before it moves towards $186. However, if SOL bears step up, as suggested by the sell signal, investors might witness the token dropping to its support near the $129 range.
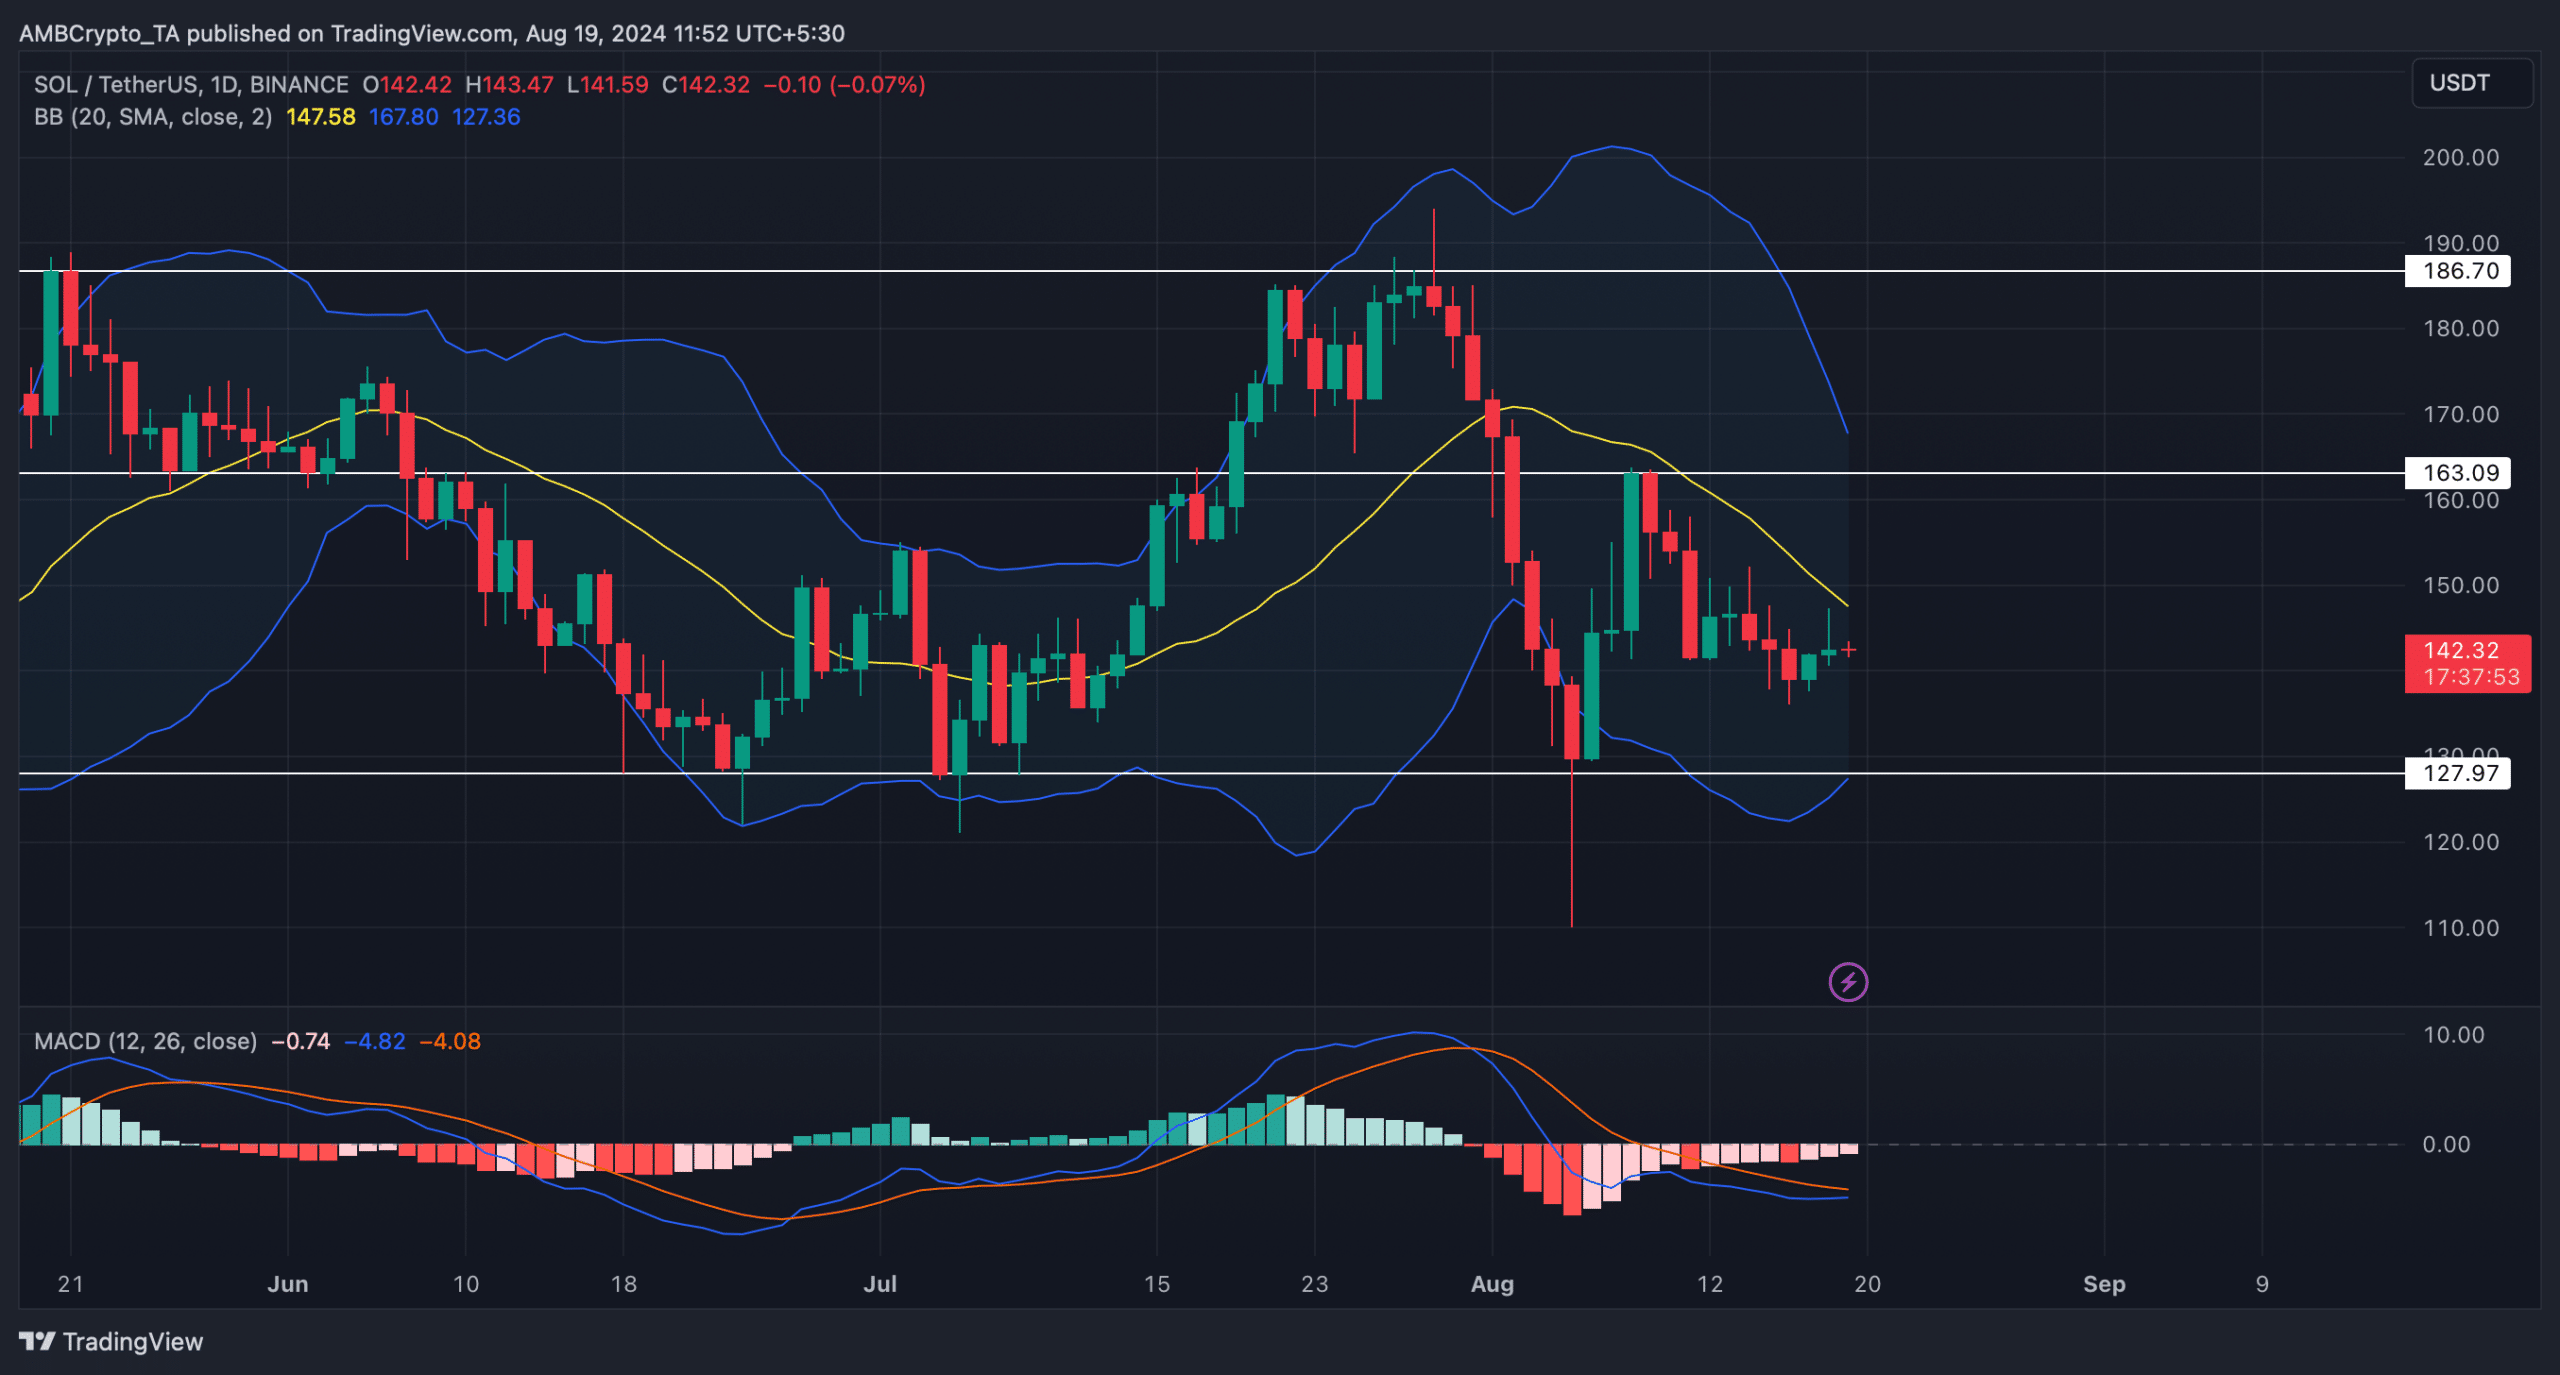
Source: TradingView