Solana price prediction – SOL’s $180 target depends on THIS working out
Solana had a large liquidity pool at $145. Will the short-term trend reverse now as the zone was swept?
- Solana has a long-term bullish market structure.
- The resistance overhead could be retested once again based on the findings from the liquidation heatmap.
Solana [SOL] managed to address the issues of its downtime a month ago and maintained consistent uptime in April. However, its price action remained underwhelming, and a bearish bias was present for traders.
A recent AMBCrypto report noted that the 7-day NFT transactions on Solana outnumbered Ethereum [ETH] and Polygon [MATIC].
Solana’s revenue was also up by 33.3%, but the memecoin frenzy was fading. This saw decreased decentralized exchange volumes and total value locked (TVL).
The fair value gap could present a significant challenge
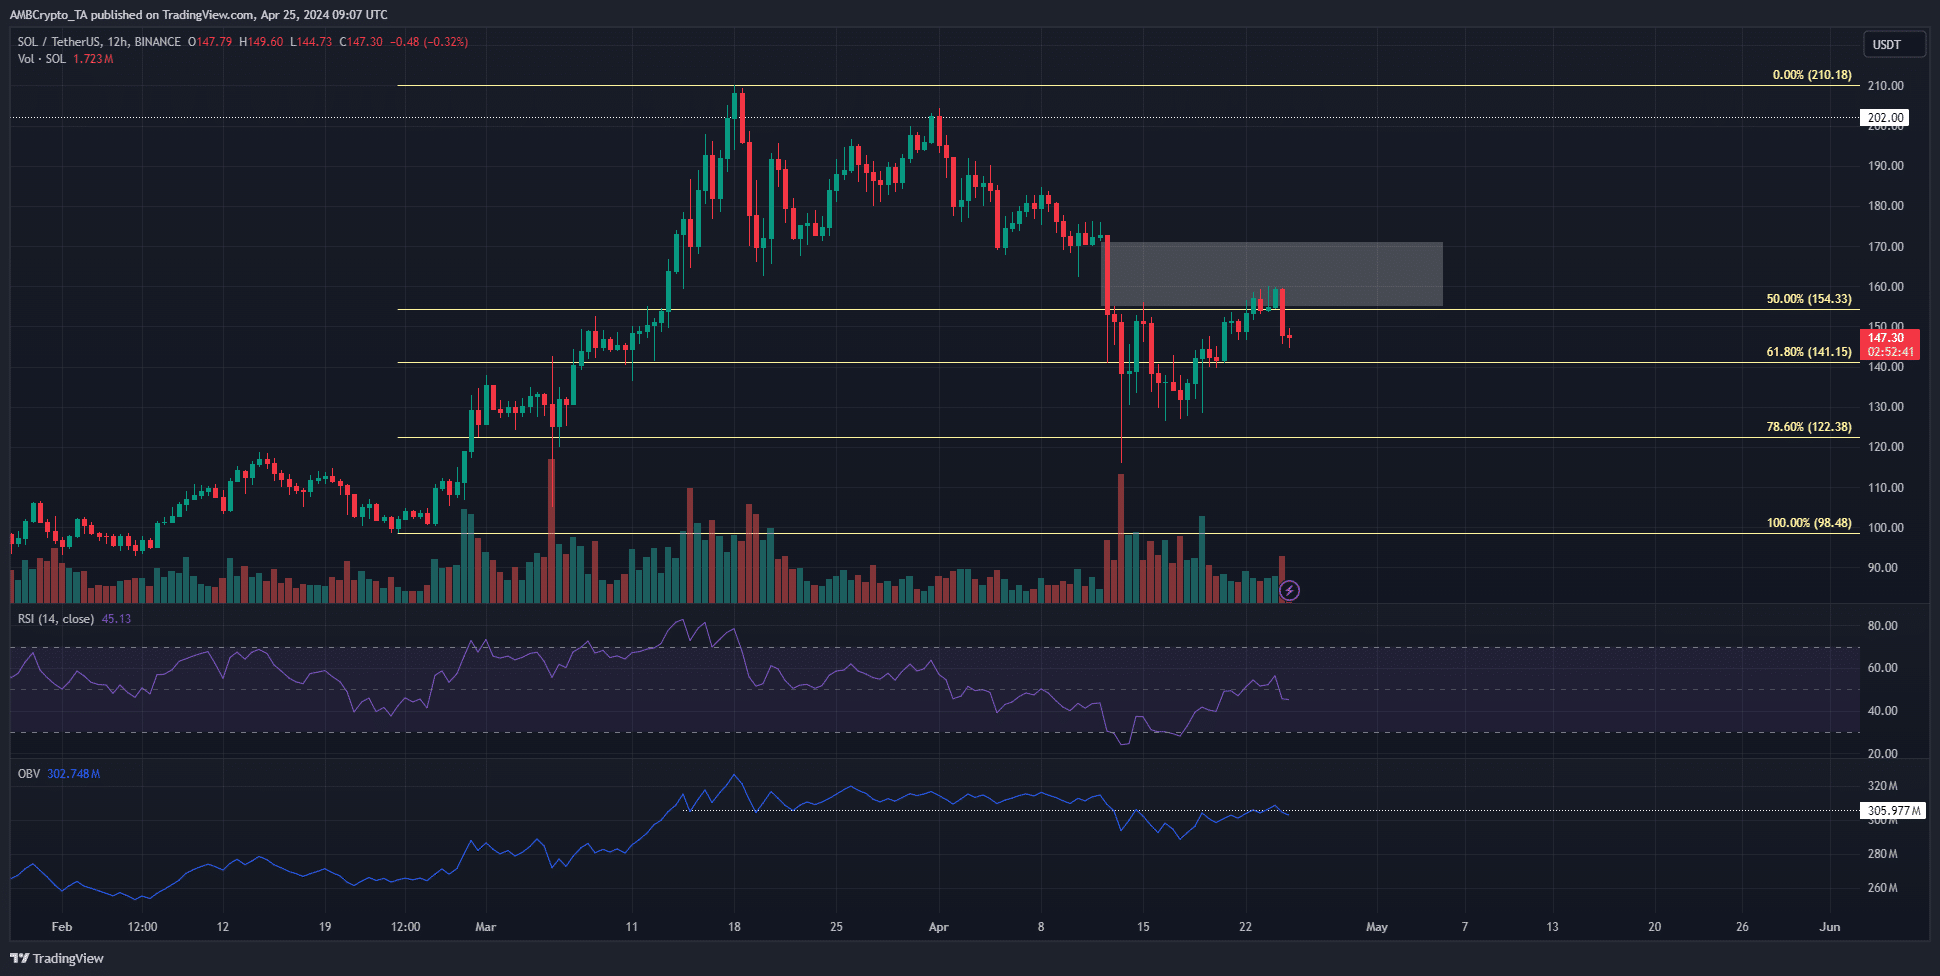
The long-term trend of Solana was bullish after the rally in late February and March. Yet, in the near term, the bias was bearish. This was due to the series of lower highs and lows that SOL formed in April.
The RSI reading was 45 but has been below neutral 50 for most of April. This highlighted bearish momentum. The OBV has also been in a downtrend and was at a resistance level at press time.
Additionally, there was a fair value gap (white box) in the $160 zone. This region served as support in March and acted as resistance now.
The Fibonacci retracement levels (pale yellow) at $141.15 and $122.38 were likely to be tested in the coming weeks before bulls could reverse the trend.
The liquidity northward could see a quick reversal
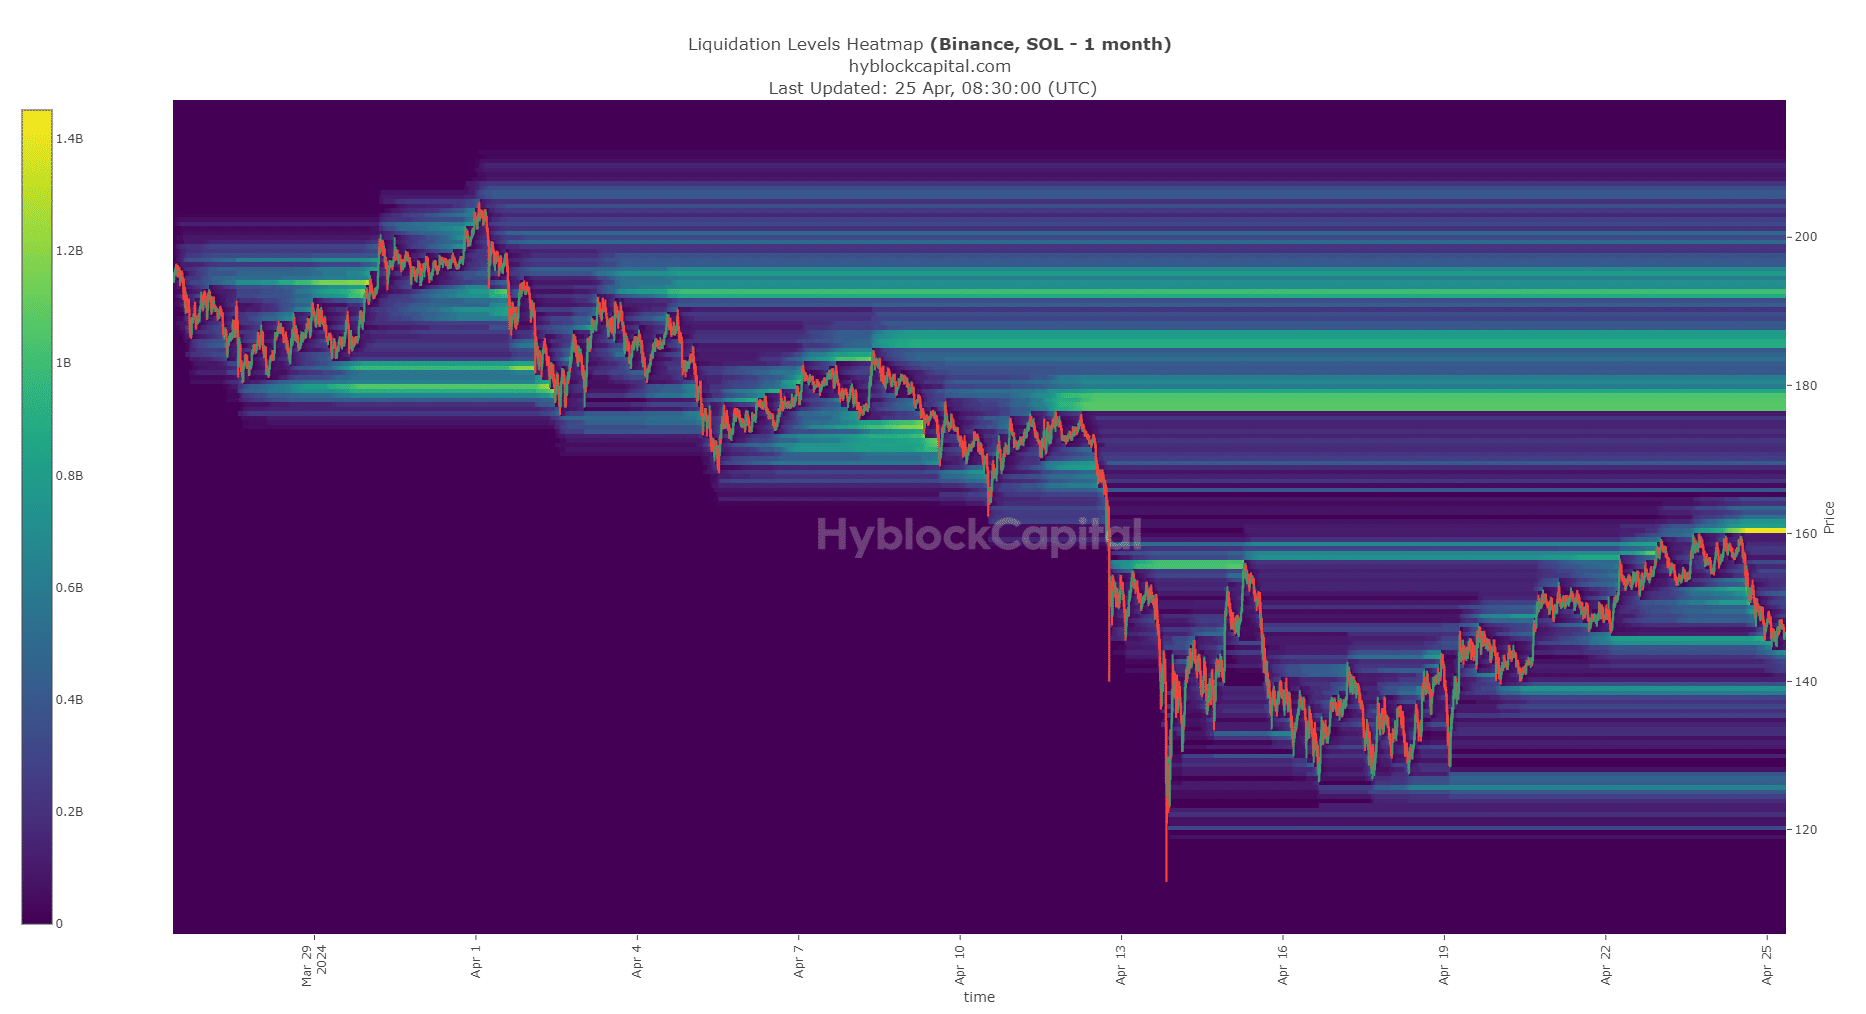
The liquidation heatmap showed that the $143-$145 was a significant liquidity pool in the near term. The past few days saw SOL reverse from $157 to $145 to collect this liquidity.
To the north, the $160 level had a large concentration of liquidation levels.
Is your portfolio green? Check the Solana Profit Calculator
Therefore, it was likely to be a magnetic zone that would attract Solana prices to it in the coming days. This would likely be followed by another reversal as SOL likely lacked the strength to establish an uptrend.
On the other hand, if the $165 level was surpassed, the $180 region would become the next target.
Disclaimer: The information presented does not constitute financial, investment, trading, or other types of advice and is solely the writer’s opinion.


