With Ethereum, Cardano and other alts, this movement is unlikely at the moment!

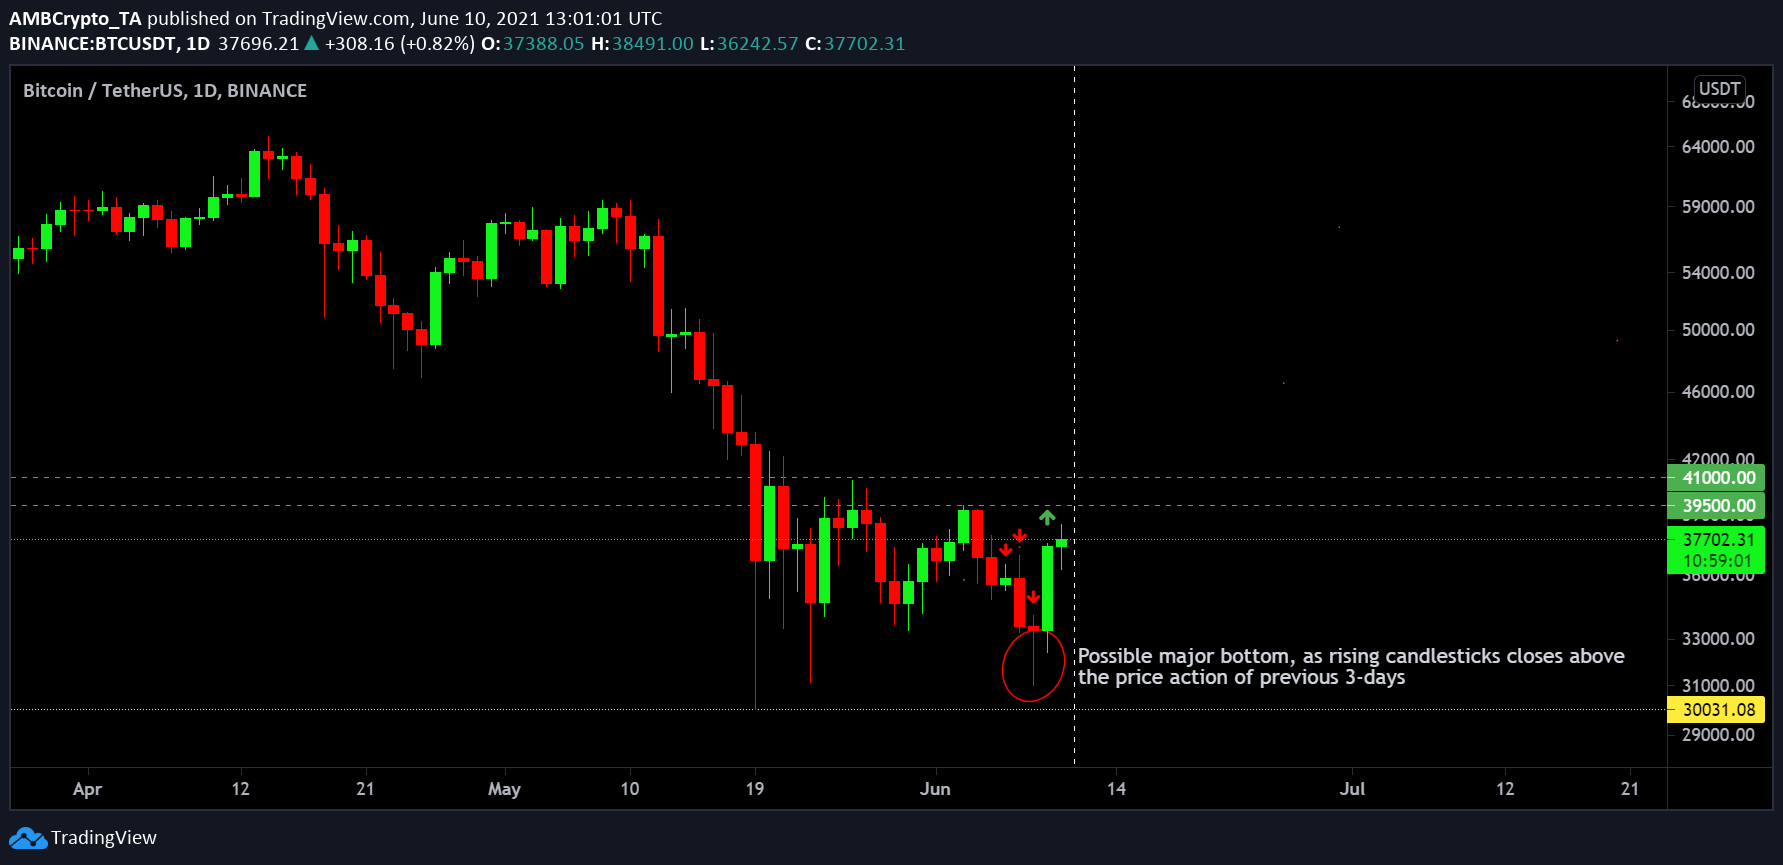
A welcome sight for the sore eyes. On 9th June, Bitcoin rallied by 12% in the charts recording its highest surge since the collapse of May 19. In fact, the last time BTC was up by more than 12%, was back on February 8th. The rally has continued at press time, with the price consolidating above $37,500.

BTC/USDT on Trading View
One particular factor indicative of a definitive bullish reversal was the formation of a major bottom. As identified in the charts, Bitcoin’s daily price candle on June 9th closed above its previous three days of price movement. Historically, such a condition has conveyed immediate bullish recovery.
However, under choppy market conditions, one signal is not enough. According to data, the price might have surged over the past 24 hours, due to a tiny short-squeeze.
Bybt.com indicated that half a billion dollars worth of liquidations, and major positions are already being opened on Bitfinex. So while Bitcoin might be looking at a probable short-term rise, it might not trigger any altcoin rally.
No fuel from Stablecoins?
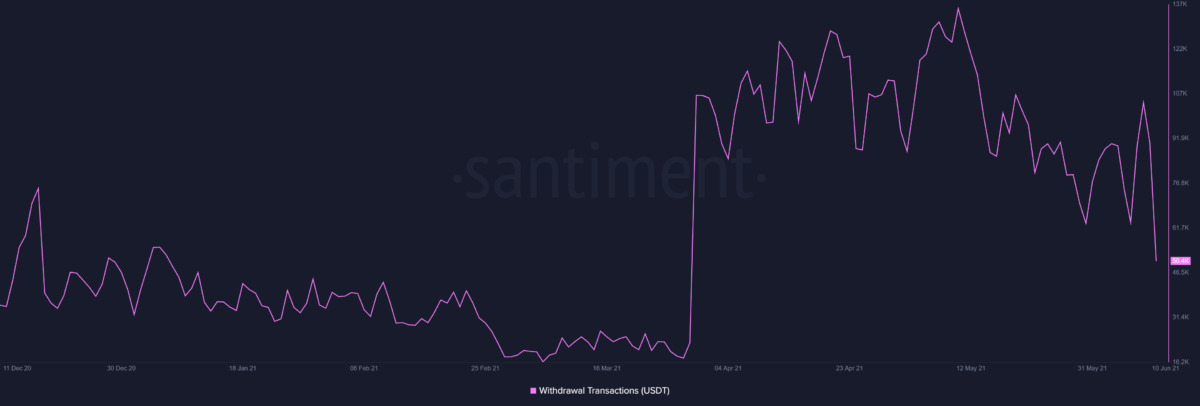
One particular observation noticed with Stablecoins is that its withdrawal transactions dropped during the same time Bitcoin surged. Stablecoins withdrawal transactions (here it is USDT) refer to all the incoming and outgoing transactions involving USDT withdrawal addresses. Now, withdrawal transactions dropping in the charts would mean that there are fewer orders going through that are buying crypto-assets. In short, there is a relatively weaker accumulation.

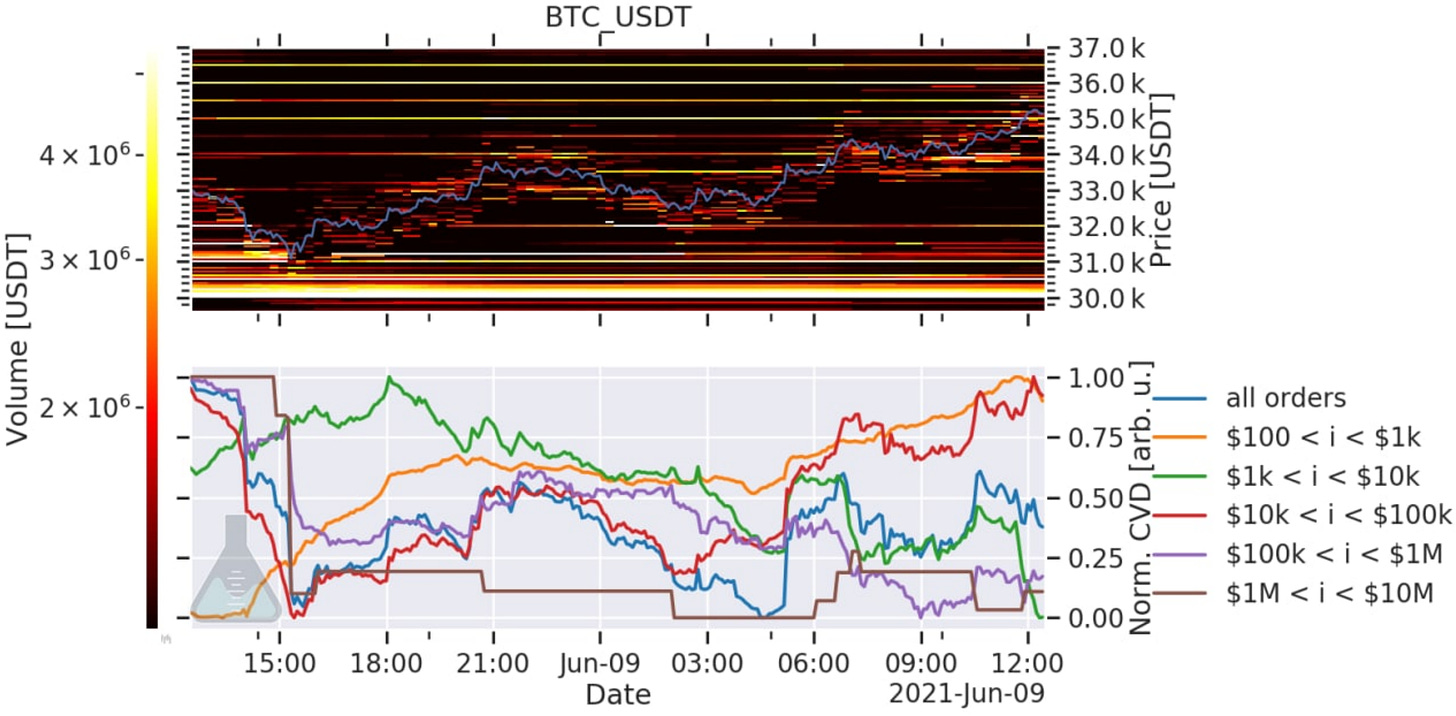
Source: Jarvis Labs
Similarly, CVD indicator above suggested that market movers are currently not involved with the price movement. The price is moving on a variable range, and it may land anywhere on the spectrum, in the short term.
Ethereum/Bitcoin chart is hardly supportive
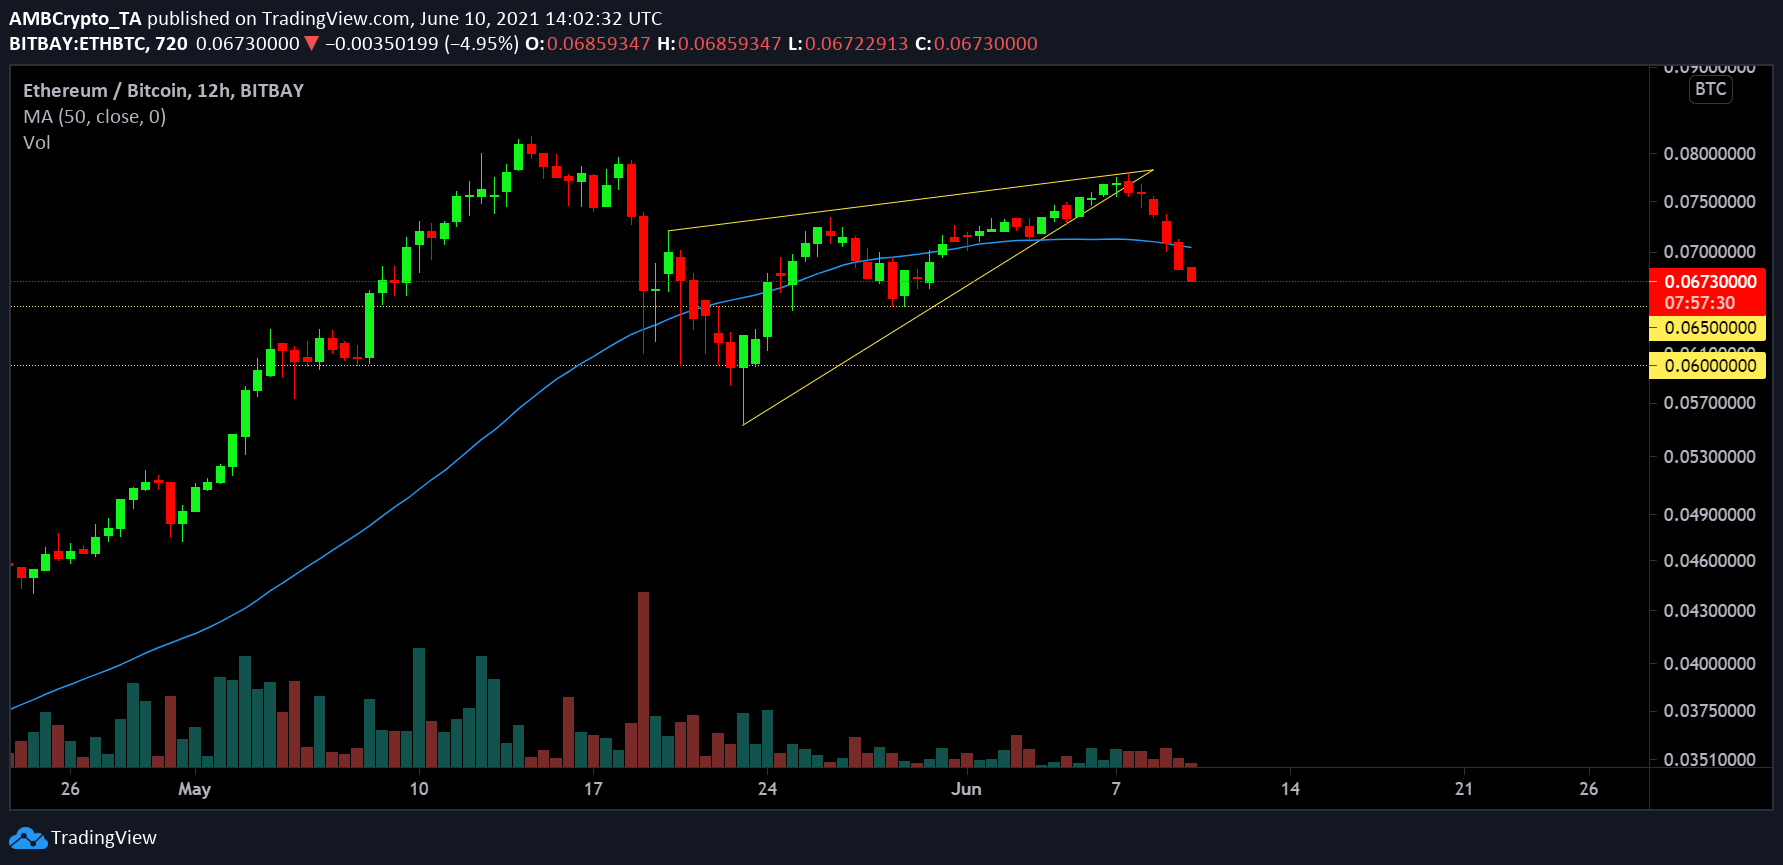
According to Coingecko, none of the assets in the top 20 ranked have matched BTC’s rally in the past 24-hours other than Polkadot (10.4% to BTC’s 7.3%). Ethereum improved by a meager 1.1%. Cardano spiked by only 0.2%. Ethereum’s present dissociation with Bitcoin was identified on the ETH/BTC chart as well.

ETH/BTC on Trading View
The ETH/BTC chart, which has been a good indicator for the Altcoin rally, has been on sliding over the past couple of days. Due to Bitcoin outperforming Ethereum, it is unlikely at the moment, for other tokens to march behind Bitcoin as well.
Now, on a yearly scale, Statistics continued to suggest that the ecosystem is still in an Altcoin Season but in the short term, the index has flipped towards Bitcoin. With Bitcoin unsure of its own rally range, Altcoins should not incur much over the current trading week.


