With Litecoin unable to break the $54 resistance, is a 10% drop imminent

Disclaimer: The findings of the following analysis are the sole opinions of the writer and should not be considered investment advice.
- Litecoin rejected multiple times at $53.8 resistance in recent weeks
- A move below $50 could hearten the bears
The USDT Dominance metric saw a sharp pullback on 13 October, but it has quickly made up ground. This showed that market participants favored holding on to Tether over the past couple of days. Throughout October, this metric has been on the rise. At the same time, Litecoin [LTC] has shown little to no significant trend on the price charts.
Here’s AMBCrypto’s Price Prediction for Litecoin [LTC] in 2022
On the lower timeframe charts, LTC was able to climb past the $54 mark for a couple of days but was unable to stay there. More recently, the price slipped beneath $52 and looked to have flipped it to resistance as well. Where will LTC bulls next make their stand?
Litecoin does not offer a high probability buy or sell opportunity yet
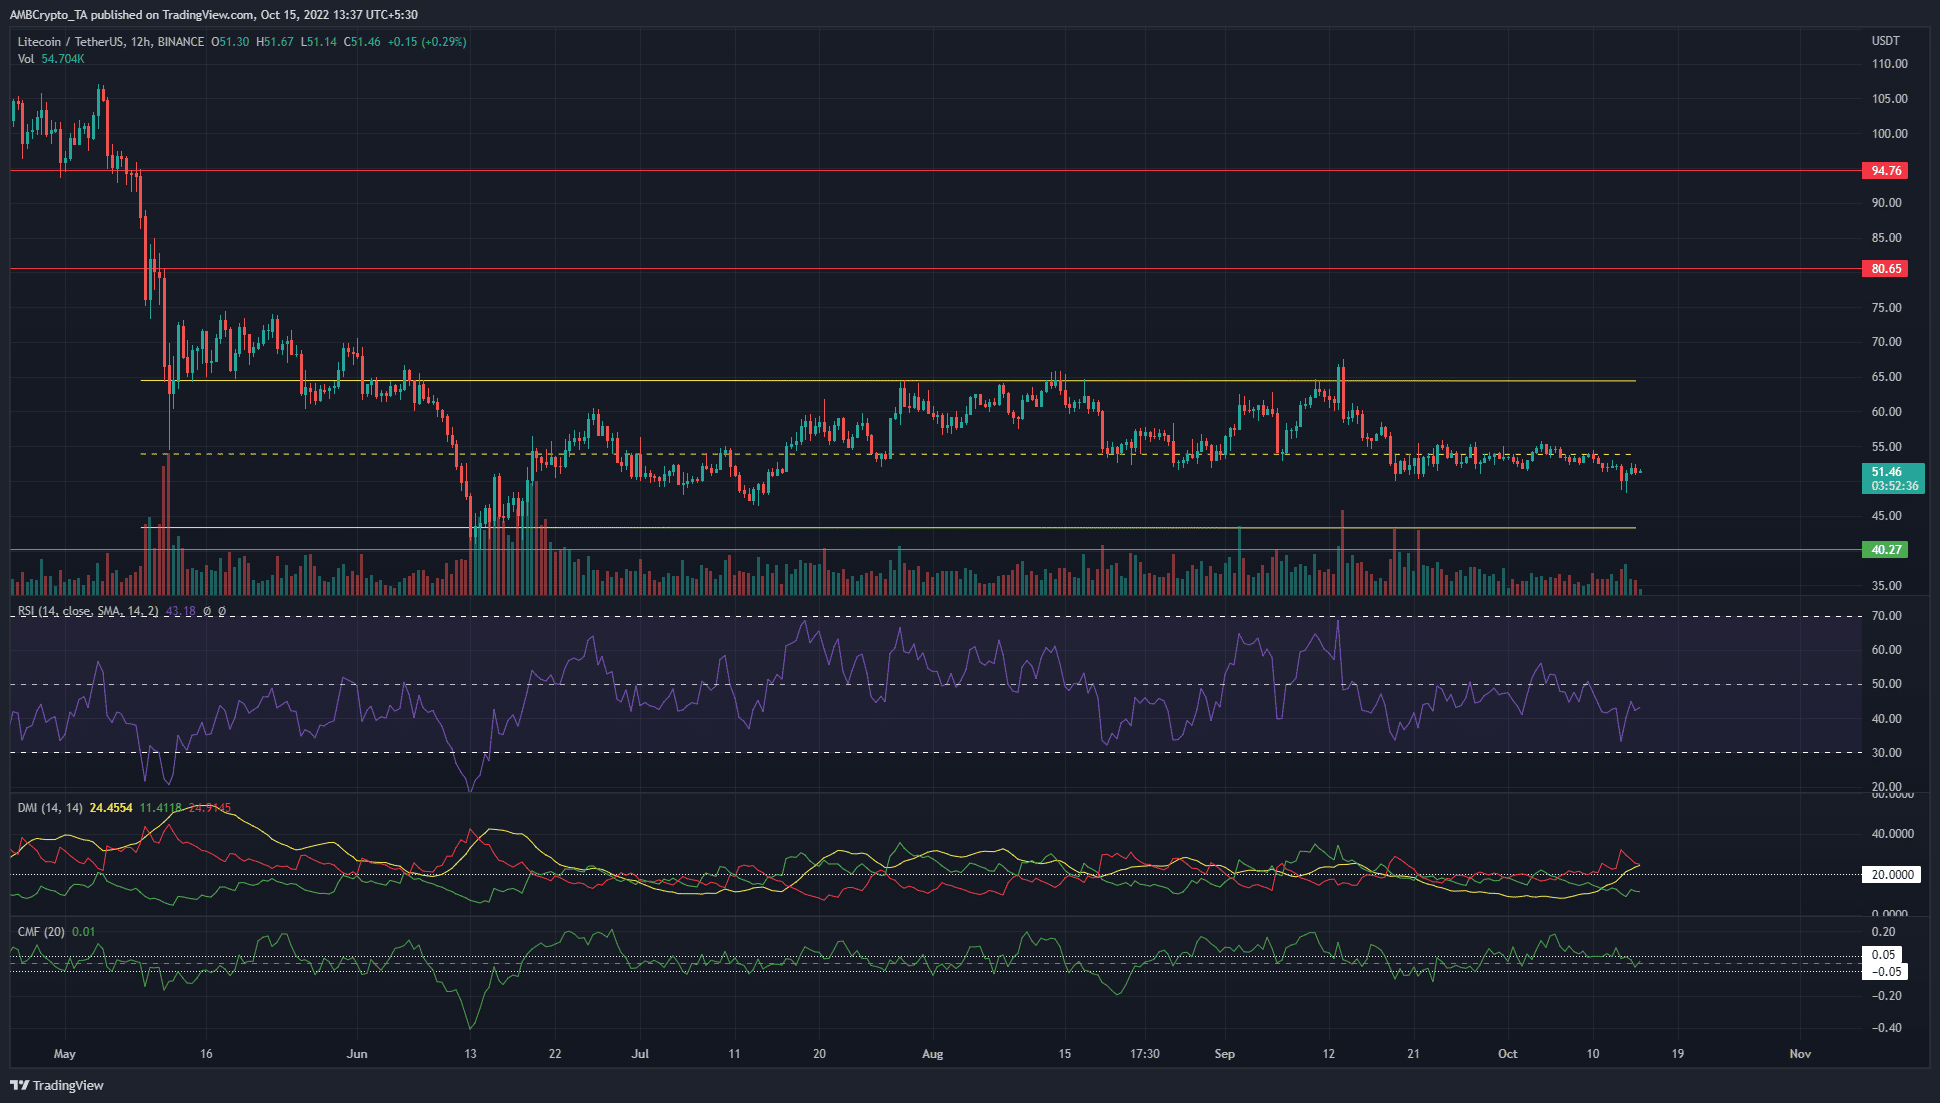
Since May, Litecoin traded between the $64.5 resistance and $43.4 support. The mid-point of this range lay at $53.9. In recent weeks, Litecoin has been shackled to this mid-range value. LTC has neither been able to climb above $55, nor could it sink below the $51 mark convincingly.
At last, the market might have made up its mind. The selling pressure on 13 October forced the price as low as $49. At the time of writing, the lower timeframe key level at $52.3 was flipped to resistance. If the bears can follow through, LTC could descend to the range lows near $44 once more. Around $45, Litecoin can be examined once more to see if it offered a buying opportunity.
LTC social dominance unable to break the 0.4% ceiling
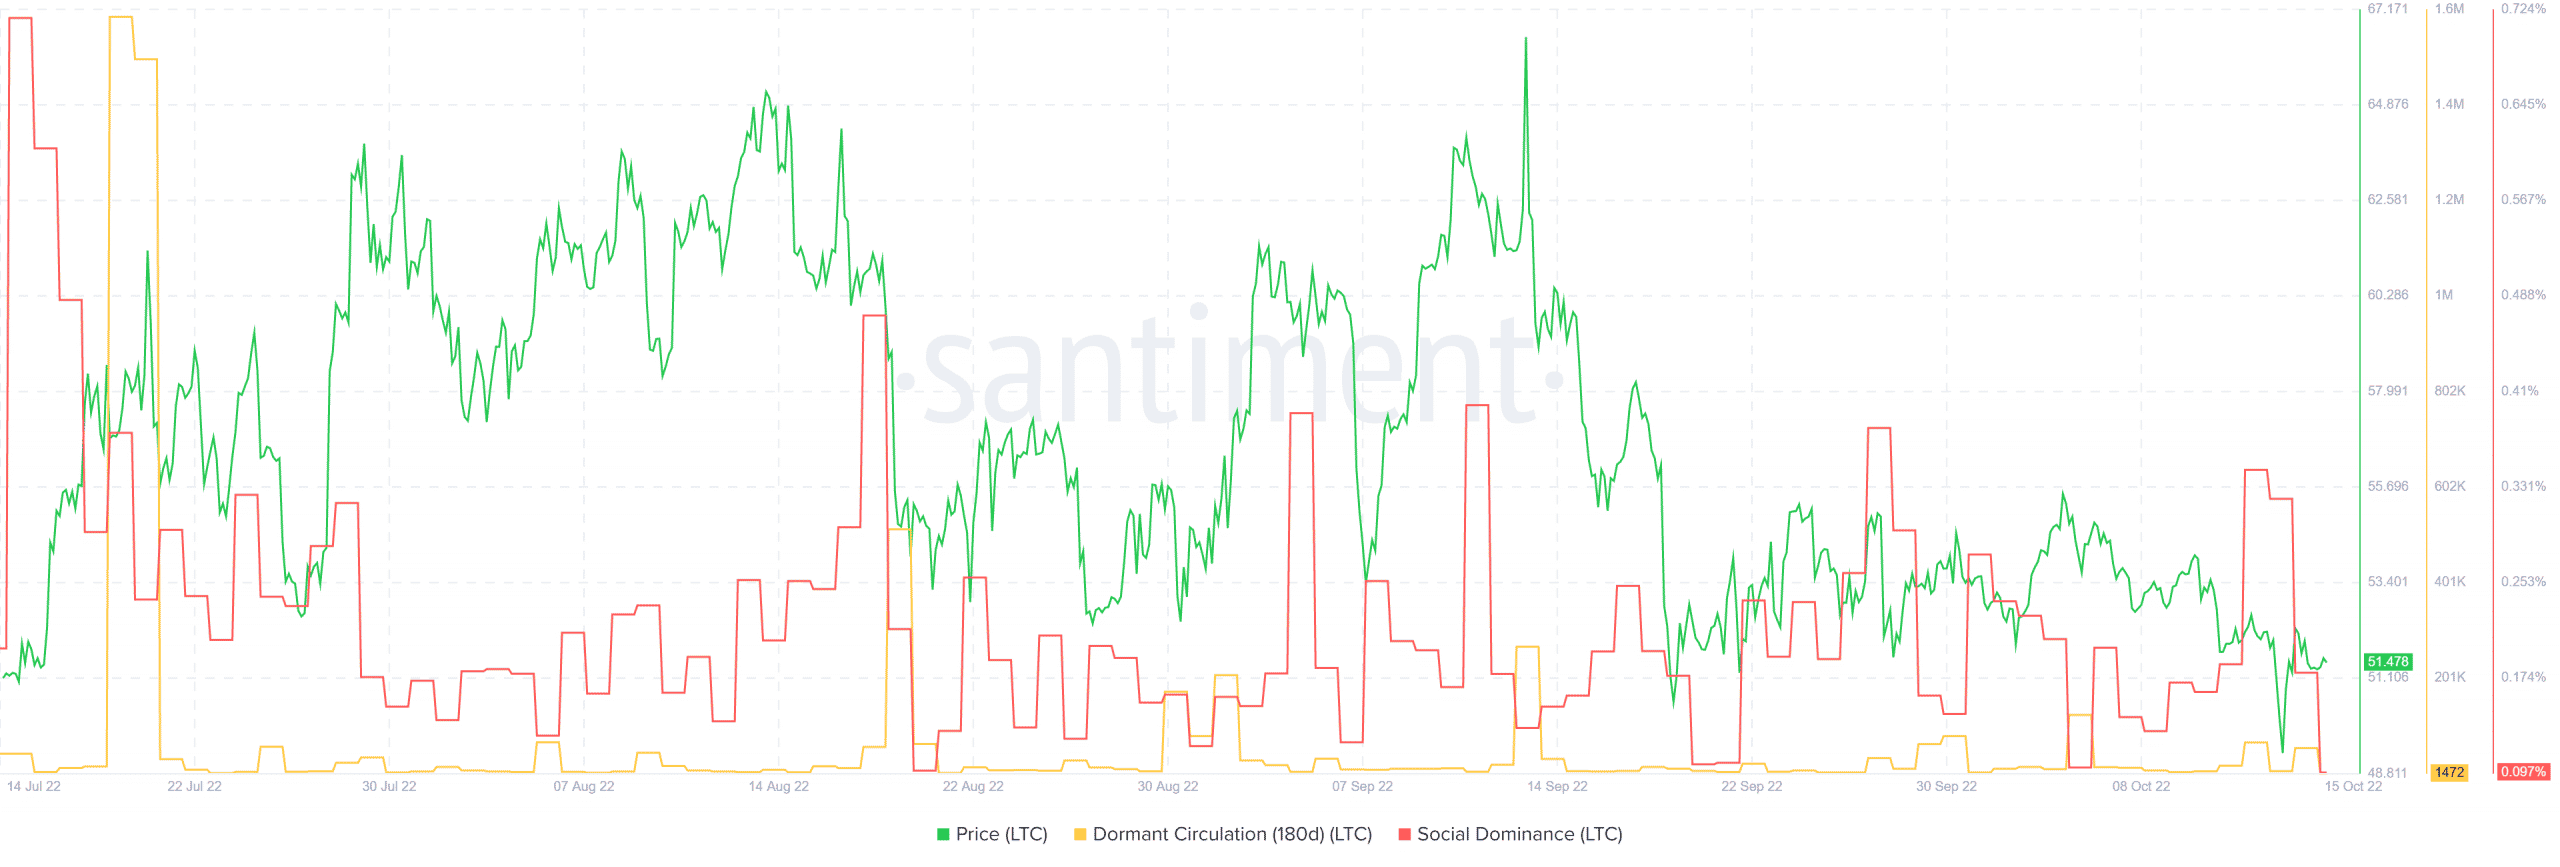
The 180-day dormant circulation saw a spike August, and once again in mid-September. The latter surge coincided almost exactly with a local top for LTC. Although this need not always be the case, a swell in this metric can be something to watch out for.
Social dominance was also something Litecoin struggled with in recent months. The dominance metric has not pushed above 0.5% since July. In recent weeks, it peaked repeatedly near the 0.41% mark. This showed that, compared to the dozens of other assets in the market, LTC was not among the most popular.
If Bitcoin slipped beneath $19k again, the $18.5k region would be tested once more. If this too gave way to the bears, Litecoin would likely follow BTC downward on the price charts.