With selling pressure on BTC, will MATIC break past $2 in February

Disclaimer: The findings of the following analysis are the sole opinions of the writer and should not be considered investment advice
Polygon’s native token MATIC registered strong gains in the past week when it climbed from $1.49 to $2.1, before getting rejected at a long-term resistance level. Polygon has had some positive news surrounding it in the past couple of weeks, such as setting a dApp milestone. However, the selling pressure on Bitcoin in the twelve or so hours preceding the time of writing, saw MATIC take a hit as well.
The $2 area was a round-number resistance level. Also, a long-term resistance level. The price tested this level twice in quick succession in the past few days and looked prepared to climb higher. However, bullish momentum began to weaken even as the price attempted to push higher- a sign of weakness. In the next few hours, BTC also dropped from $45.4k to $43k.
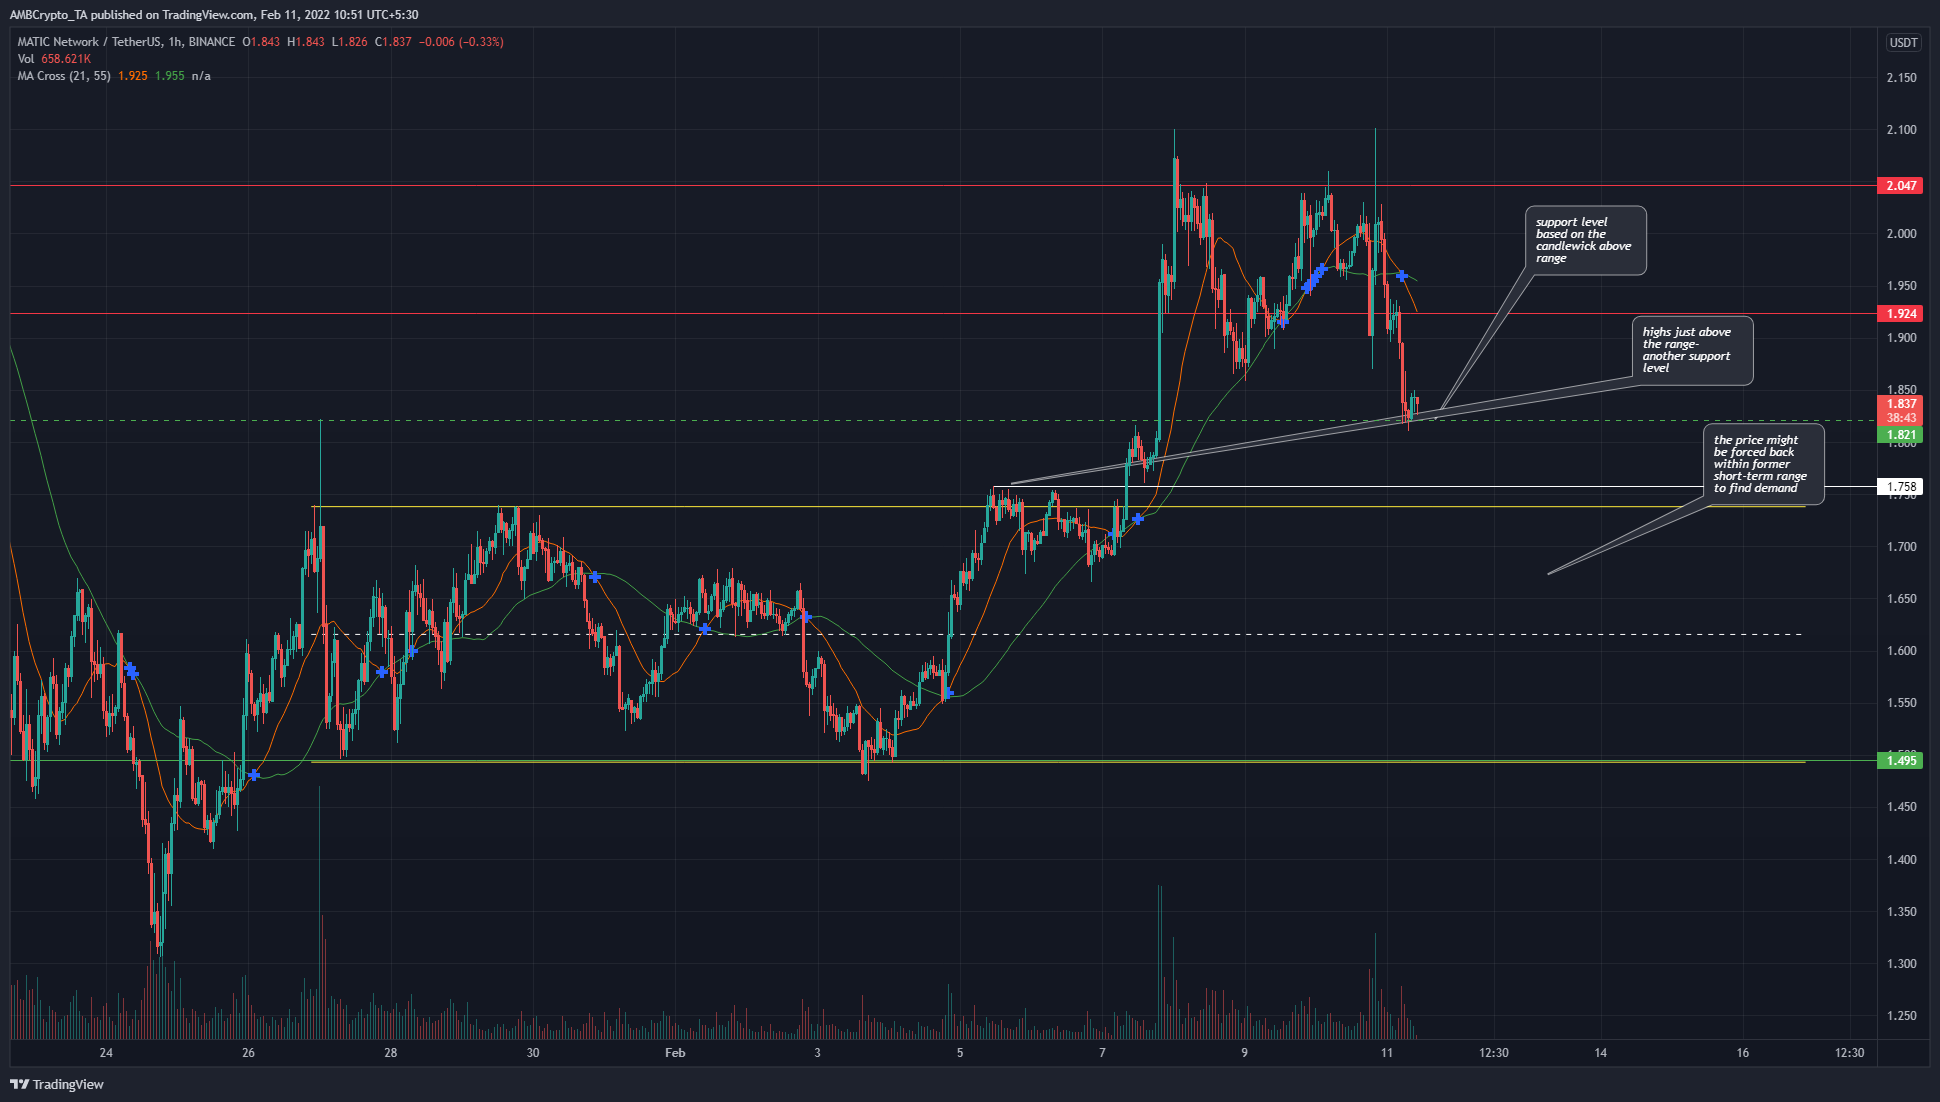
As highlighted on the charts, the price was treading water above the $1.84 level, a short-term support level. In the past two weeks, it has spent some time trading within a range (yellow) from $1.49 to $1.74. Therefore, the range highs and the highs registered on the charts just before a true breakout from the range, at $1.75 and $1.73, was an area that could act as support should the price drop below $1.82.
At the time of writing, the near-term market structure was bearish- the highs at $2 were not broken while the previous higher low at $1.88 has seen a session close beneath it. The path forward could be further lower in search of demand.
Rationale
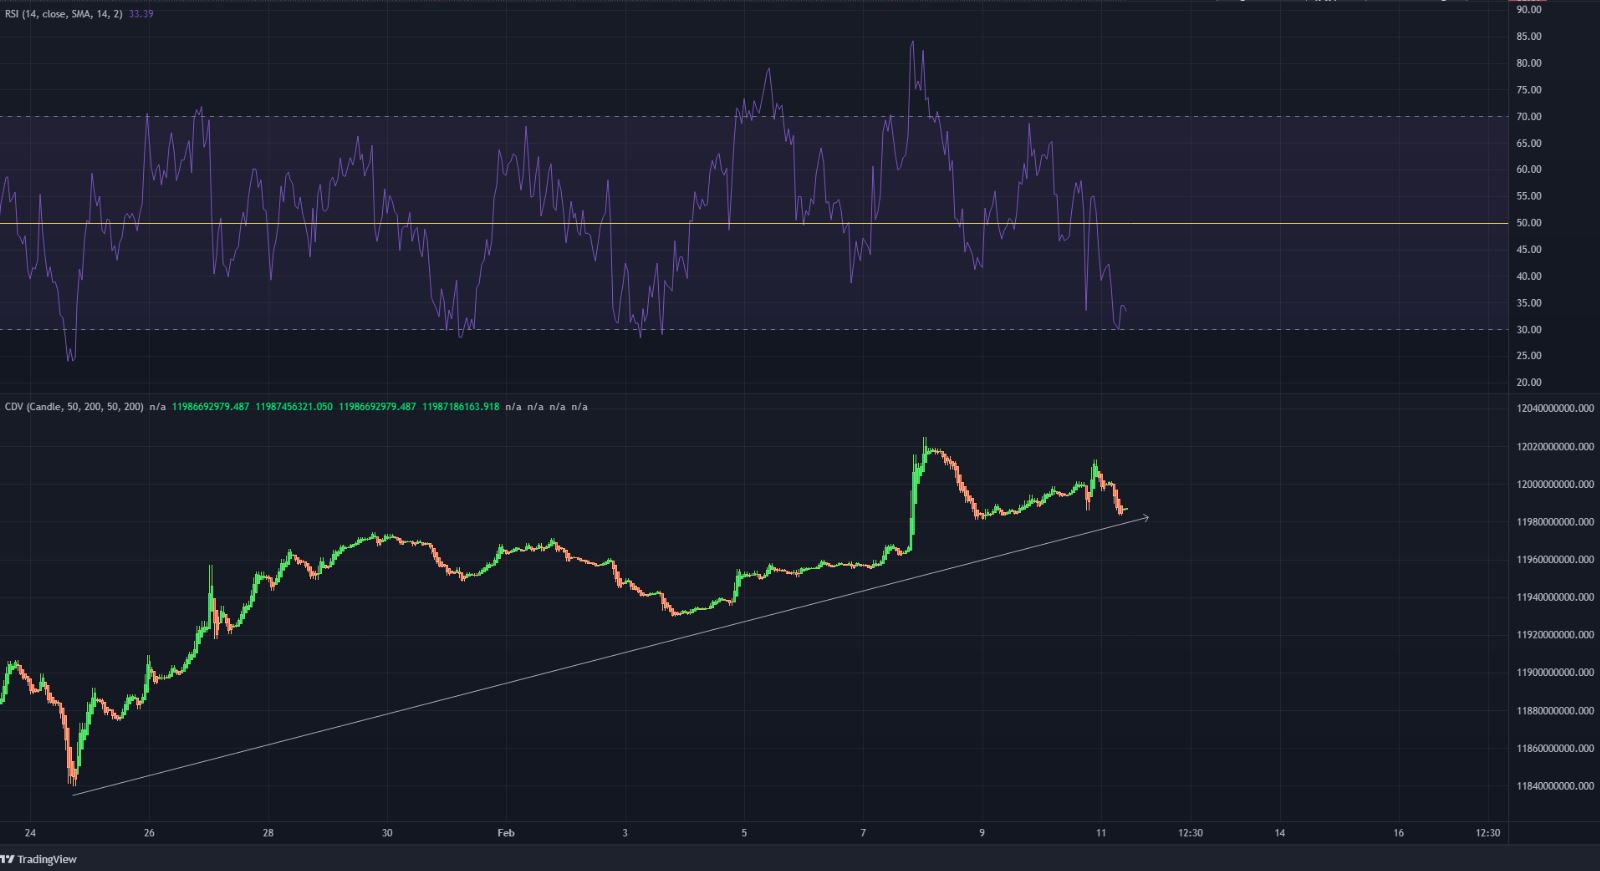
The price tested $2 just a couple of days apart but in the same time period, the RSI showed a decline on the hourly chart. This meant that bullish momentum was weakening, although the price pushed higher. This bearish divergence was followed by a dive toward $1.82. The 21 SMA (orange) also formed a bearish crossover with the 55 SMA (green).
The Cumulative Delta Volume showed that, since late January, demand has been steady behind MATIC. This showed that the price rally was genuine, and pullbacks in the next few days are likely to be buying opportunities.
Conclusion
Demand has been seen behind the price’s rally, and some short-term support levels at $1.82, $1.73, and $1.61 (mid-point of the range) were identified. Market structure has flipped from bullish to bearish in the short term, which meant that some caution has to be exercised when buying the dip at the aforementioned levels. A move by Bitcoin below $43k could drag the altcoin market lower.