Analysis

Would Shiba Inu descend lower on the price charts after a rejection at this zone
Posted:
Journalist

Disclaimer: The findings of the following analysis are the sole opinions of the writer and should not be considered investment advice.
Bitcoin held on to the $38k level as support but has seen consecutive shallow bounces from the support level in the past ten days. If BTC falls beneath this support level, it could usher in another wave of selling for the altcoins. Shiba Inu, which was already toiling under a downtrend, could post further losses if such a scenario unfolds.
SHIB- 1 Hour Chart
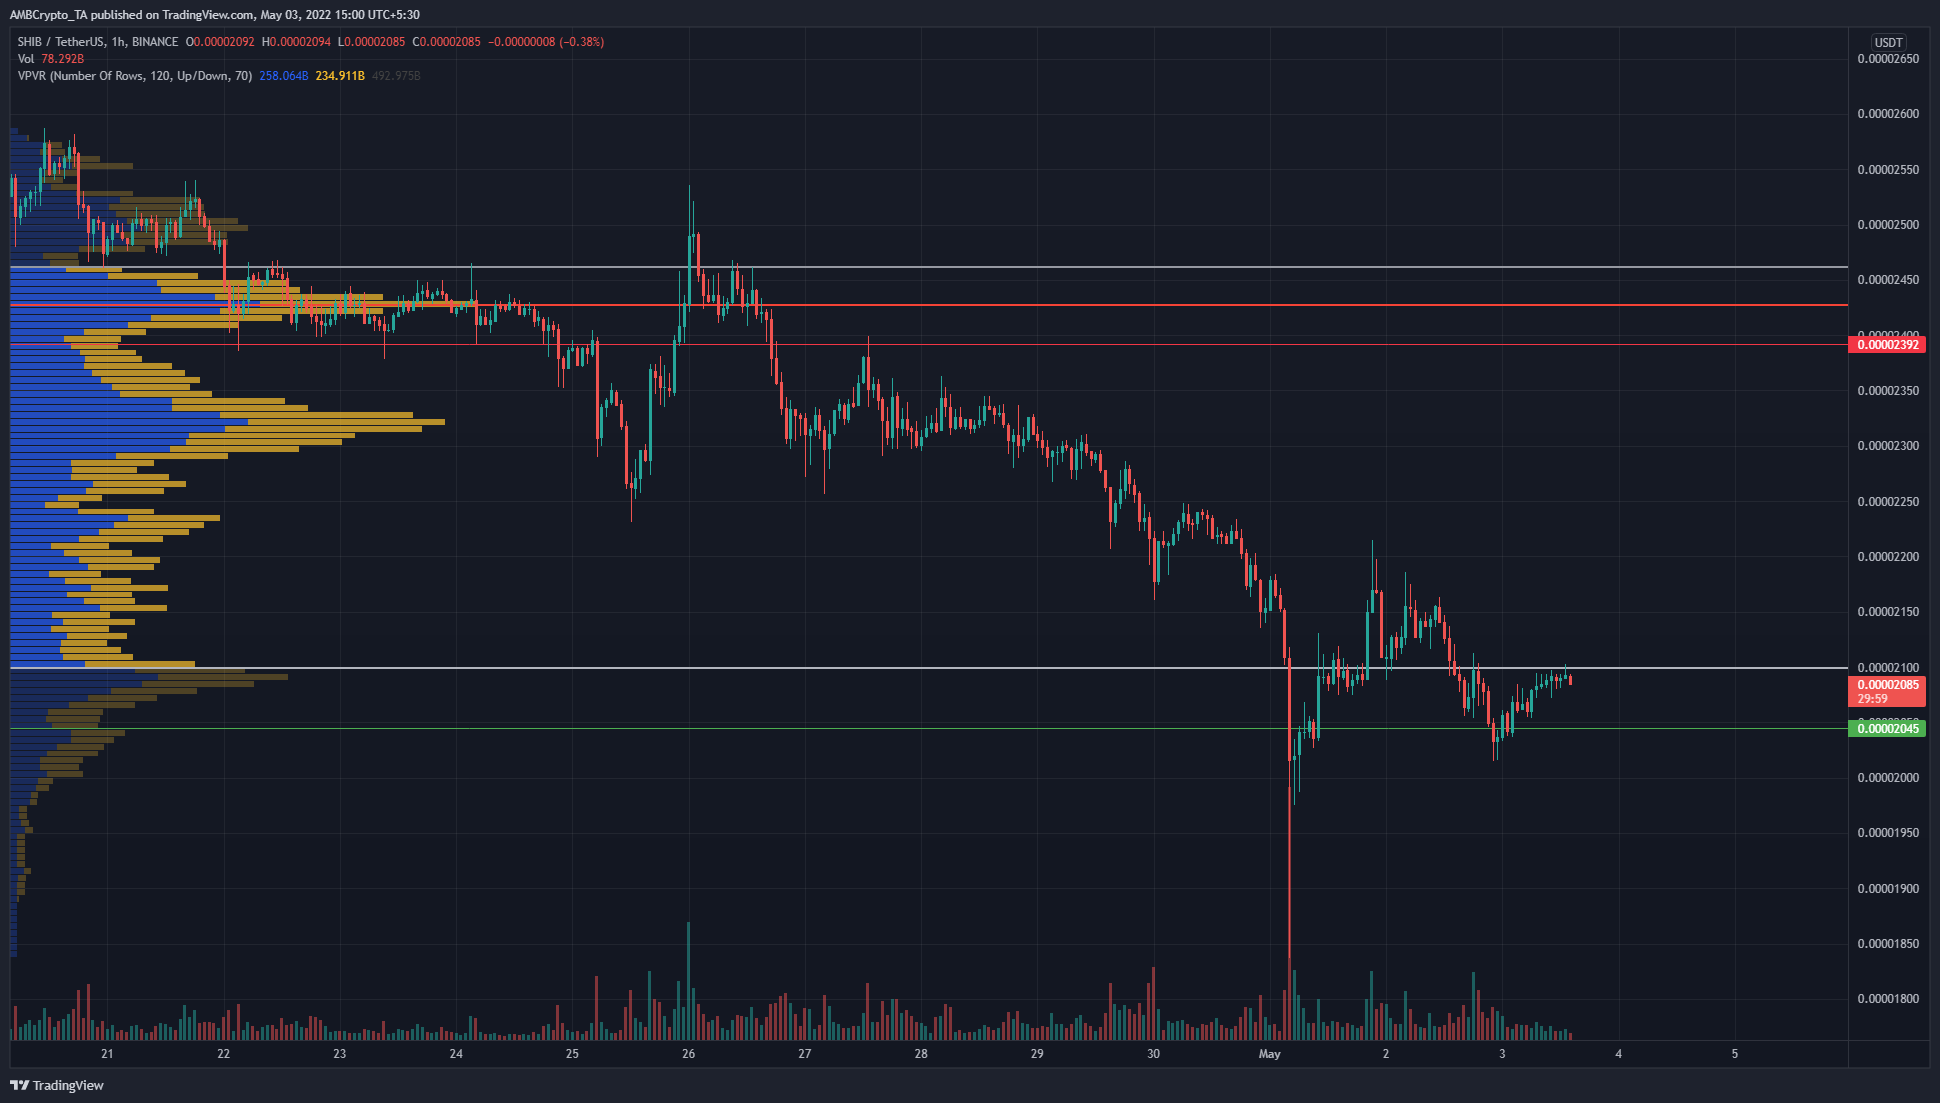
Source: SHIB/USDT on TradingView
The price action has been on a steady downtrend in the past two weeks, except for a surge to $0.000025 which was quickly reversed. This was yet another development that highlighted bearish strength.
The Volume Profile Visible Range tool was employed for the past ten days of trading. It showed the Point of Control to lie at $0.00002434, and the Value Area Highs and Lows (white) at $0.00002462 and $0.00002096 respectively. At the time of writing, SHIB slipped beneath the Value Area Lows and also retested it as a resistance.
The levels mentioned above are close to high volume nodes, which implies that they are likely to act as strong support or resistance.
Rationale
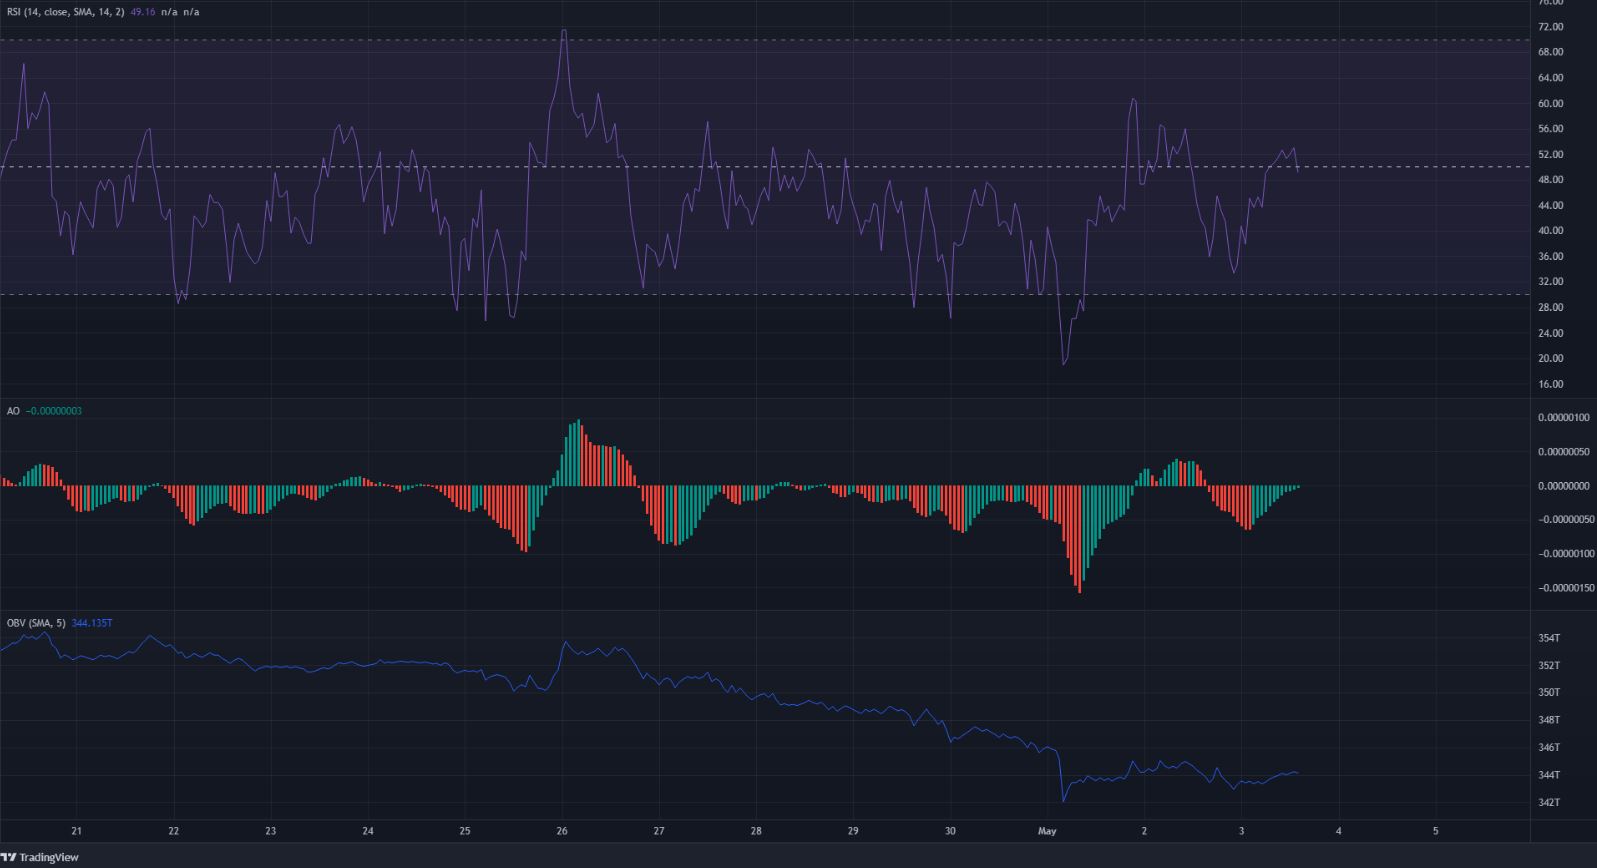
Source: SHIB/USDT on TradingView
The RSI on the hourly chart climbed above neutral 50, but it remains to be seen if the indicator can stay above 50. If SHIB is indeed rejected at the $0.000021 mark in the coming hours, another wave of selling can be expected.
The Awesome Oscillator attempted to climb past the zero line but, at press time, has not managed to do so. Hence, the momentum indicators showed neutral or weakly bearish momentum.
The OBV shed light on the steady selling pressure behind SHIB in the past few days. The bounce from the $0.00002 level did not see a large spike on the OBV, which meant the bounce was indicative of further losses to come and not a reversal in the downtrend.
Conclusion
The price action was strongly bearish for SHIB on the lower timeframes, while the OBV highlighted steady selling pressure and a distinct lack of demand for SHIB. Therefore, it was likely that SHIB would dip beneath the $0.00002 mark once more.