XDC crypto’s bullish setup strengthens – Why $1.08M in exchange inflows matter
XDC has seen a major upswing in the past day, but Spot selling pressure could limit further gains.



XDC Network [XDC] made a bullish move in the past day, signaling the presence of buyers. According to CoinMarketCap, at the time of this writing, the asset had the third-highest gains among the top 100 tokens by market capitalization.
The asset, whose total market value is $719 million, is likely to continue seeing an upswing in the short to near term, given the present price structure and indicator levels pointing toward more upside, but with conditions.
XDC faces a key test at the supply zone
Chart analysis shows that XDC’s move is conditional, given the current price structure. The asset has just traded into a supply zone that has restricted its price from surging further on multiple occasions.
Typically, the expected move from here is for the price to decline significantly and trade lower. When examined, there has been a clear rejection as the price traded into the zone, with the candle formation being slim.
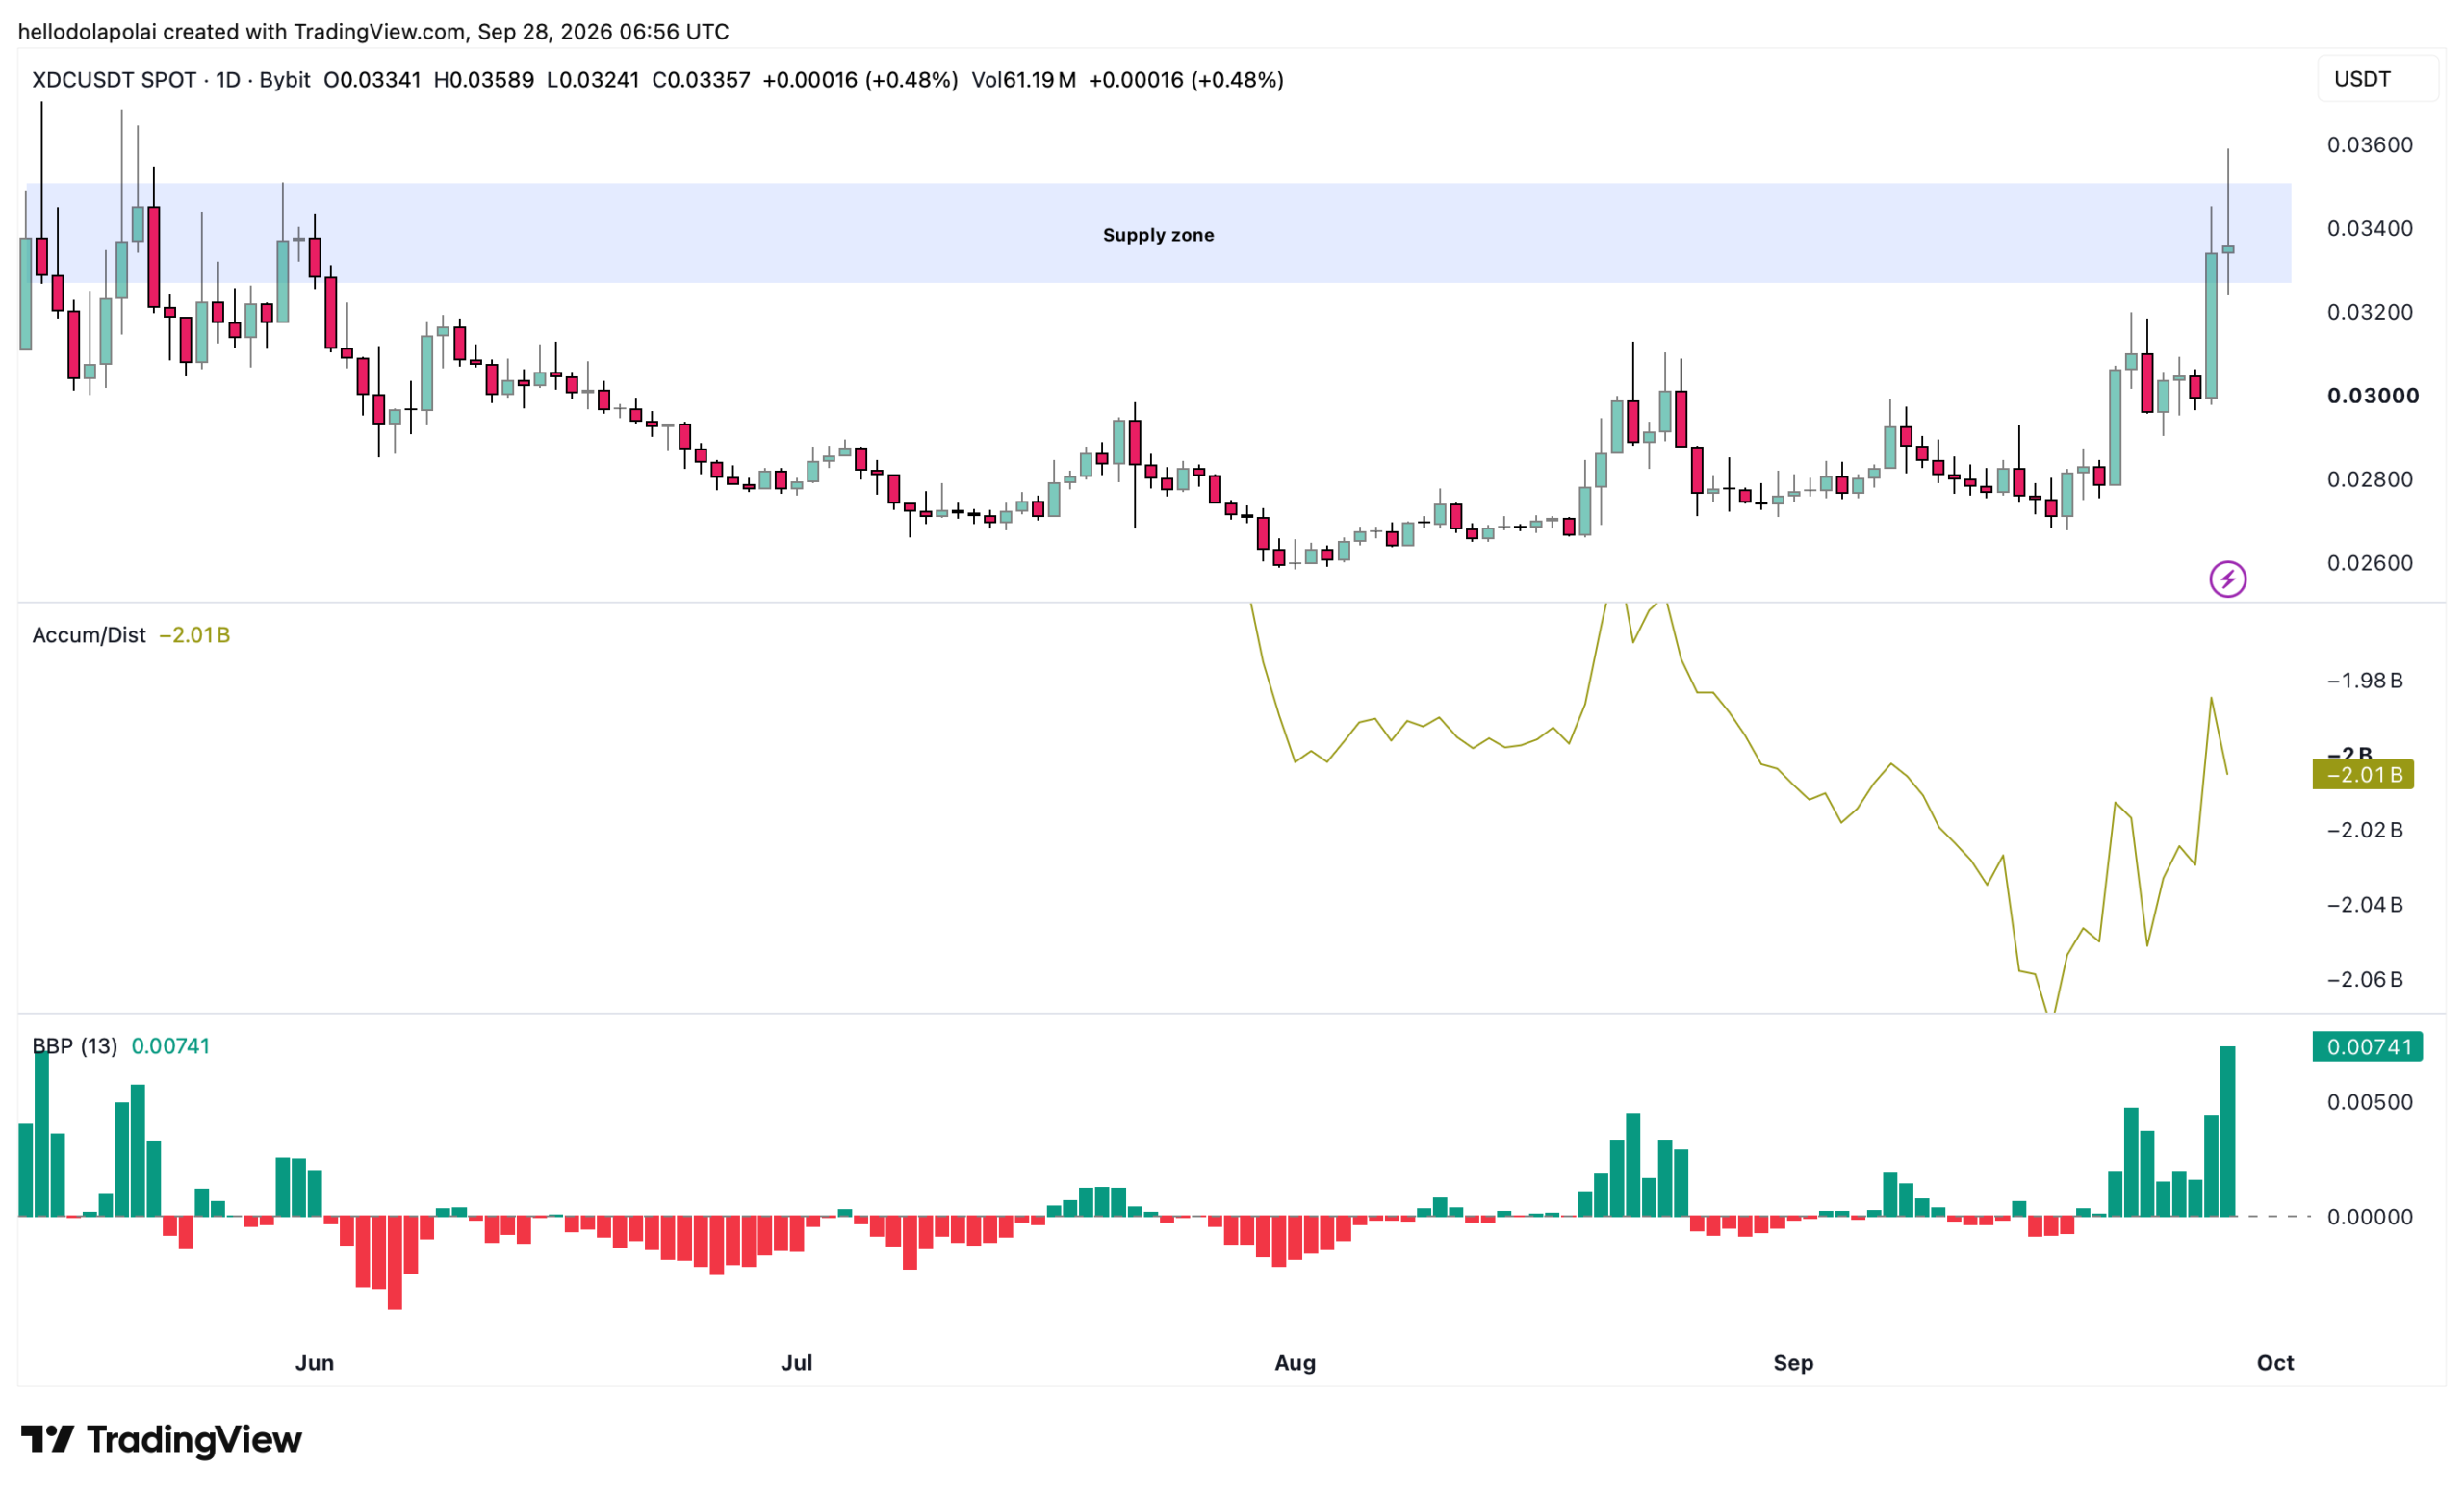
The Accumulation Distribution Indicator, while it has surged over the past couple of days, has been trending upward with pullbacks in between. In the past day, it has seen a slight pullback, dropping lower, which confirms that as the price traded into the supply zone, it triggered distribution of the asset.
This, however, does not necessarily confirm a bearish market scenario, and the drop is likely temporary, especially as the Bull Bear Power (BBP) Indicator, which measures whether bulls or bears are in control, points to the former.
The BBP confirms a bullish presence when there is a green candle formation. In fact, in this case, the BBP has formed one of its strongest green bars in days.
Perpetual market activity supports the bullish move
The perpetual market flow played a key role in supporting the performance. The Funding Rate analysis tracks whether long or short positions dominate the market. The chart shows a growing, long presence in the market.
The analysis indicates that the Funding Rate has a reading of 0.0050% as of writing, a level it has maintained for days now, while the asset has stayed largely in profit as well.
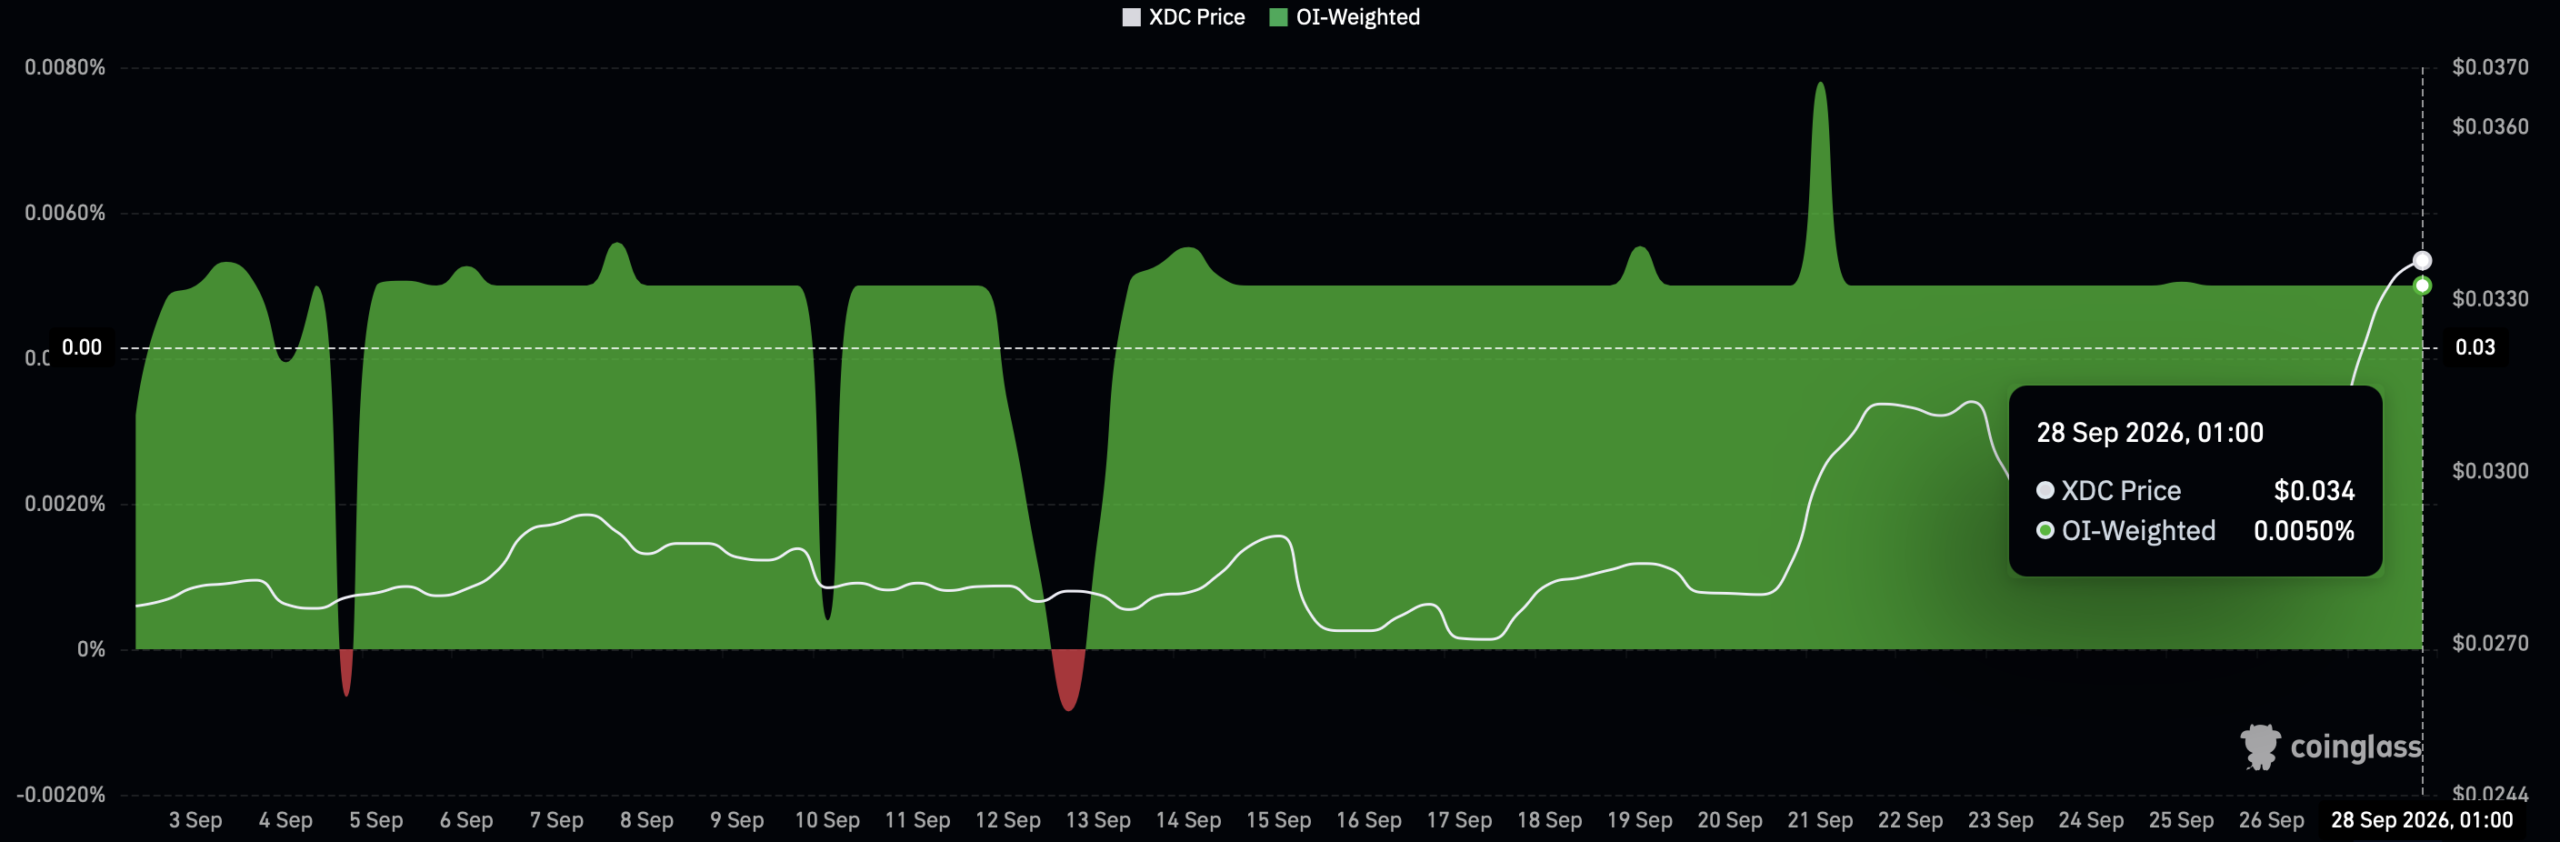
In addition, Open Interest (OI) saw an 18% surge, bringing it to $7.12 million, indicating that investors likely channeled more capital into betting on the upside of the asset.
Spot flows keep downside risks in focus
The risk of a downside has not been eliminated, based on the Spot Market Netflow, which has been dominated by sellers.
In the past 24 hours alone, the netflow sat at around $1.08 million after more XDC flowed into exchanges than flowed out. Whenever the netflow is positive, it often indicates that investors are selling and are not interested in holding the asset for a longer period.
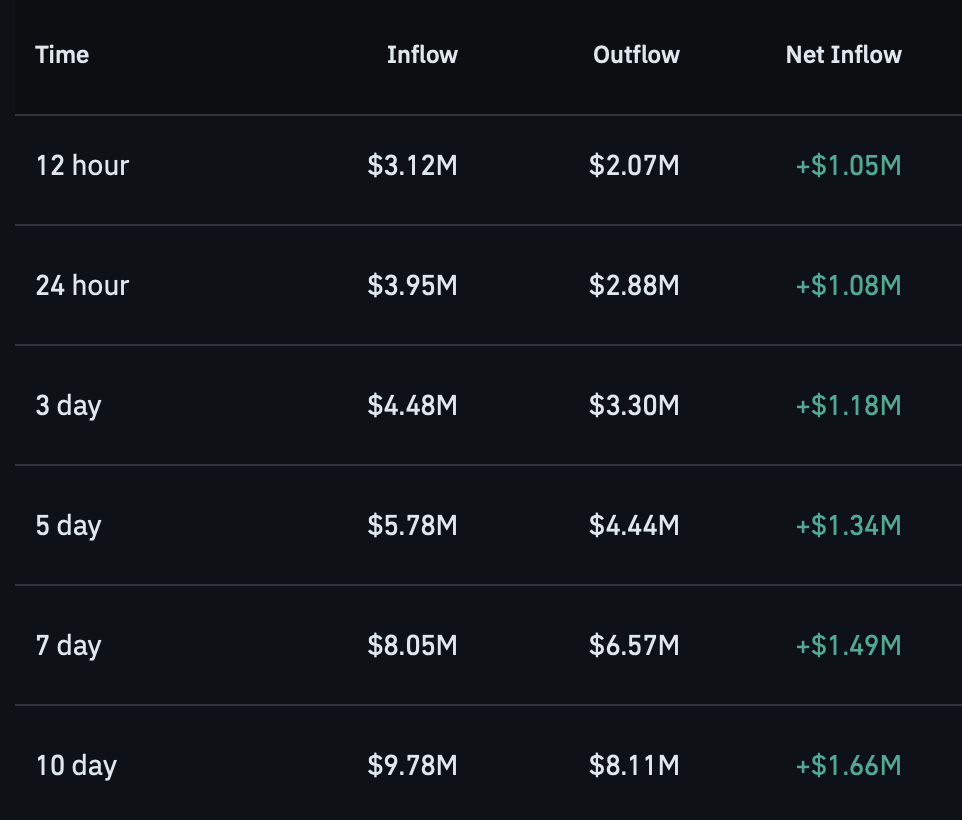
This could weigh on and slow down the chances of XDC surpassing the supply zone marked earlier. Notably, the broader trend in the Spot Market Netflow shows clear selling dominance across multiple timeframes.
Final Summary
- XDC’s bullish momentum faces resistance at a supply zone, with the BBP Indicator supporting further upside.
- Rising OI and positive Funding Rate support buyers, but Spot Market Netflow shows continued selling pressure.