XRP, Algorand, Zcash Price Analysis: 10 February

At the time of writing, XRP was projected to maintain its ascension as buying activity picked up on the charts. On the other hand, Algorand moved lower after a bearish marubozu candlestick formed on its 4-hour chart. Finally, Zcash was tipped to flip the $125.6-resistance on the back of strong bullish signals.
XRP
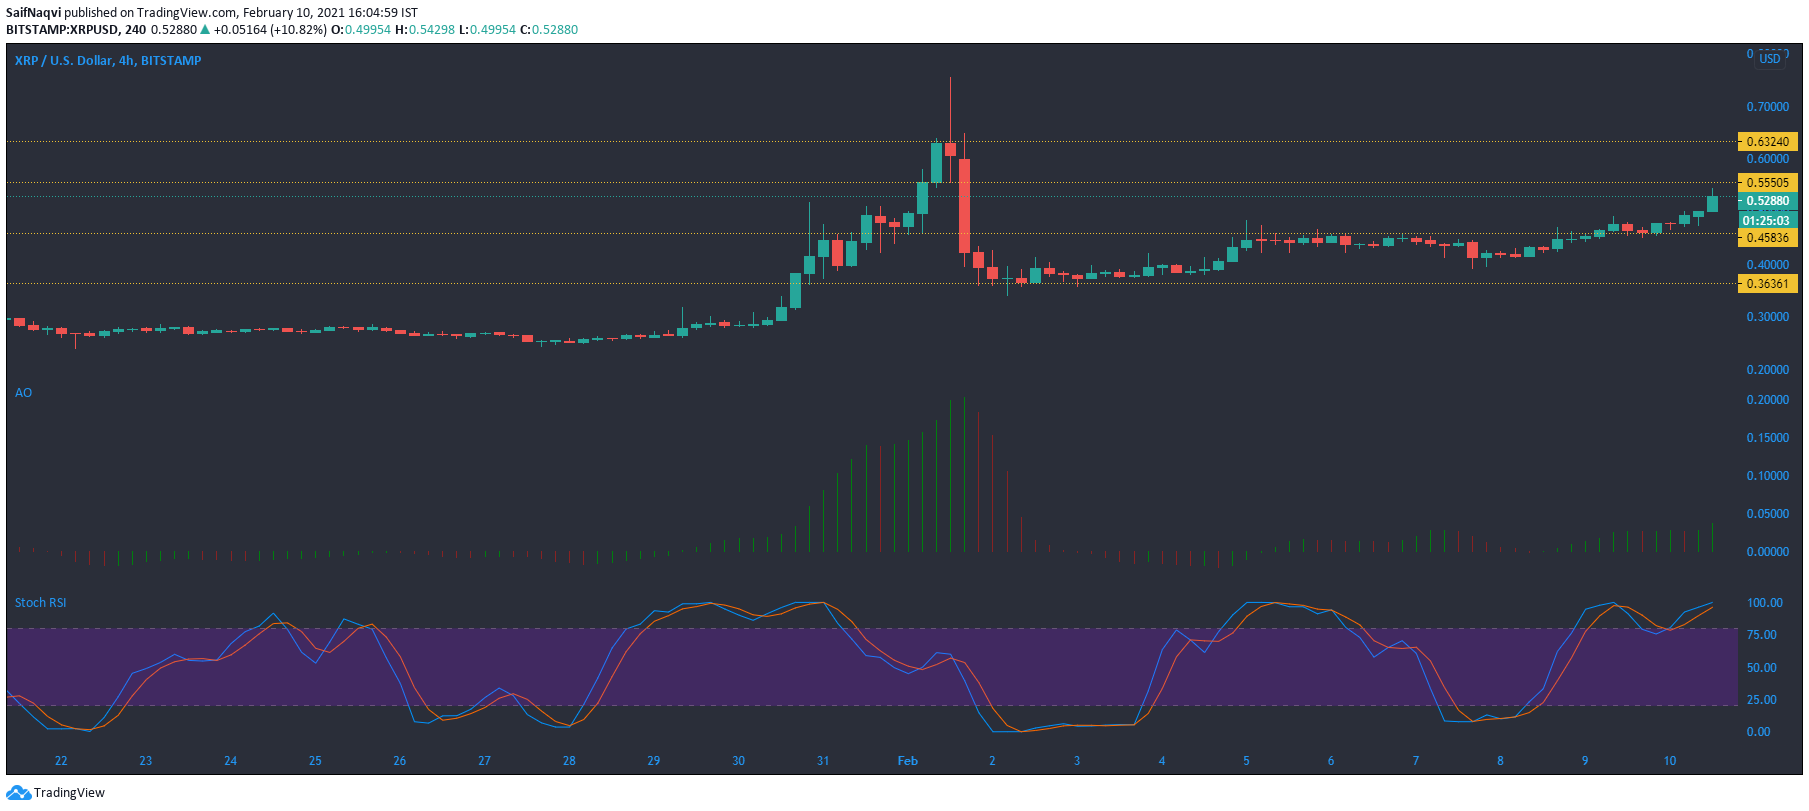
XRP’s bulls maintained the crypto’s price above the crucial support level of $0.45 as bullish momentum picked up over the past couple of sessions. The said momentum was reflected by the Awesome Oscillator as the bars switched to green on the histogram. While some saturation was seen in the market, according to the Stochastic RSI, buying activity and trading volumes picked up in the last 24 hours and countered bearish predictions.
An extended bull run could see XRP climb above the $0.55-resistance mark and target the next ceiling at $0.632. If traders decide to take profits at this price level, the support at $0458 would come under the spotlight.
Algorand [ALGO]
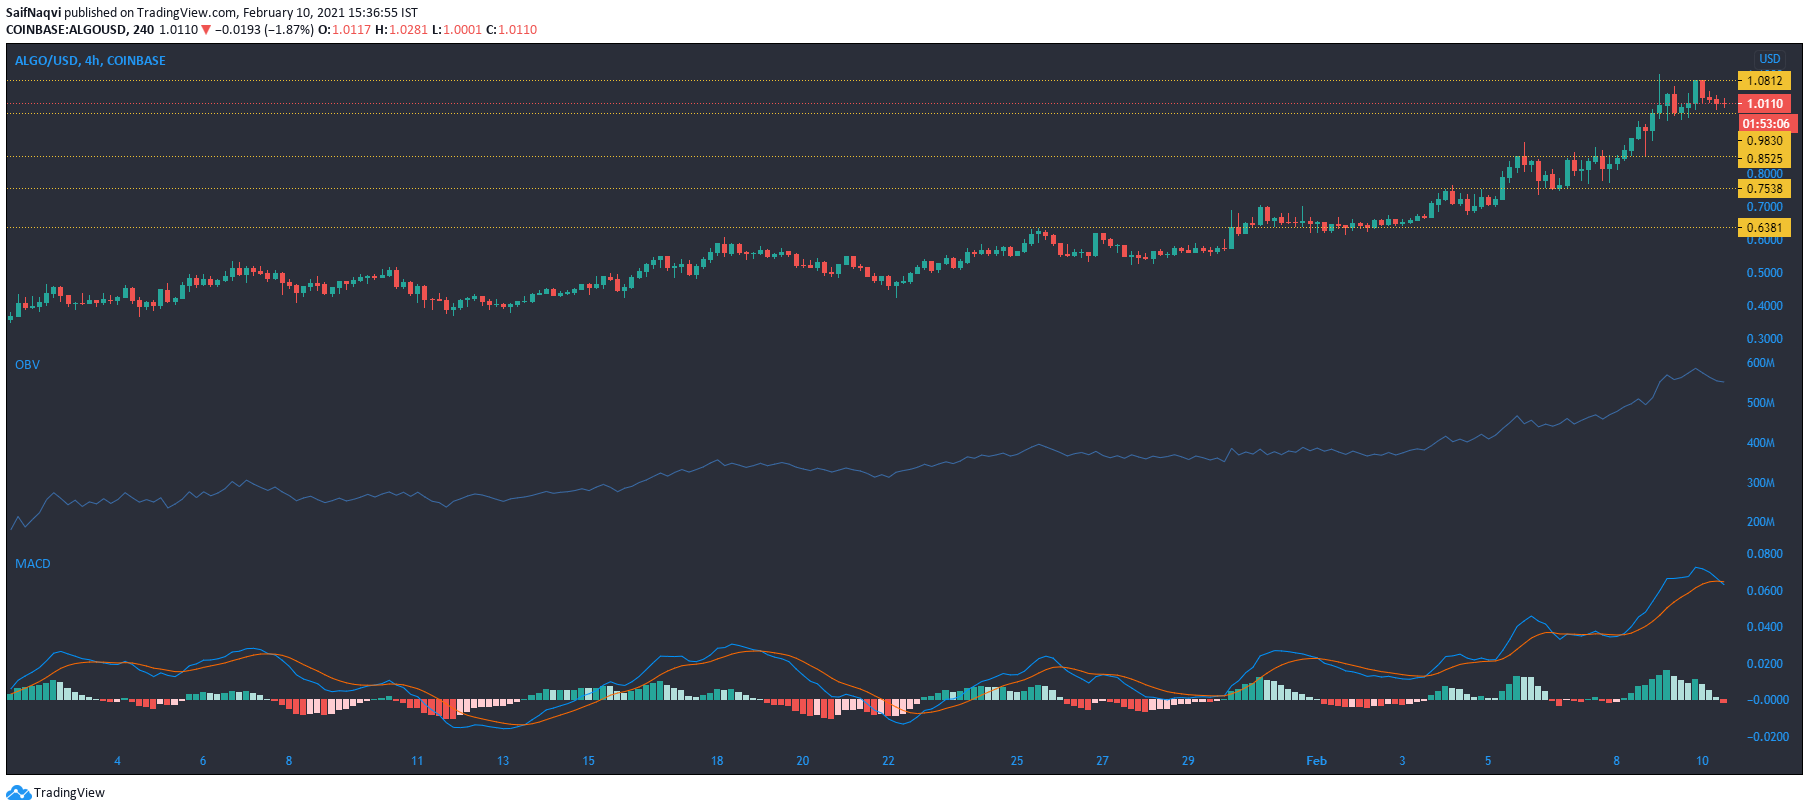
The formation of a bearish marubozu on Algorand’s 4-hour chart signaled a bearish reversal after the price snapped a local high at over $1. The sell-off was noticeable on the On Balance Volume, with the indicator moving lower over the last few sessions. A bearish crossover on the MACD showed that the sellers were ready to take control of the market.
The support levels lay at $0.98 and $0.85 in the event of a fall. However, if the bulls alleviate the selling pressure around the $0.98-support, there would be a chance of a bullish bounceback in the coming days.
Zcash [ZEC]

Zcash’s performance has been quite bullish over the past seven days as the cryptocurrency posted gains of over 20%. The uptrend was clear on the Parabolic SAR’s dotted markers which moved below the candlesticks.
Moreover, the Chaikin Money Flow showed that capital inflows were at their highest point in nearly 9 months as the cryptocurrency traded close to its November 2018 levels. Considering the recent rally in the broader market, an extended bull run was favored for ZEC in the short-term.
In such a case, the next resistance level will lie at $125.6. Conversely, a selloff at this price level could see ZEC fall towards the support levels at $109.76 and $103.58.