
XRP has continued to retain its position as the third-largest coin in the cryptocurrency ladder. At the time of writing, XRP was priced at $0.275 after a minor rise of 0.38% over the last 24-hours. The coin held a market cap of $11.88 billion and registered a 24-hour trading volume of $1.06 billion.
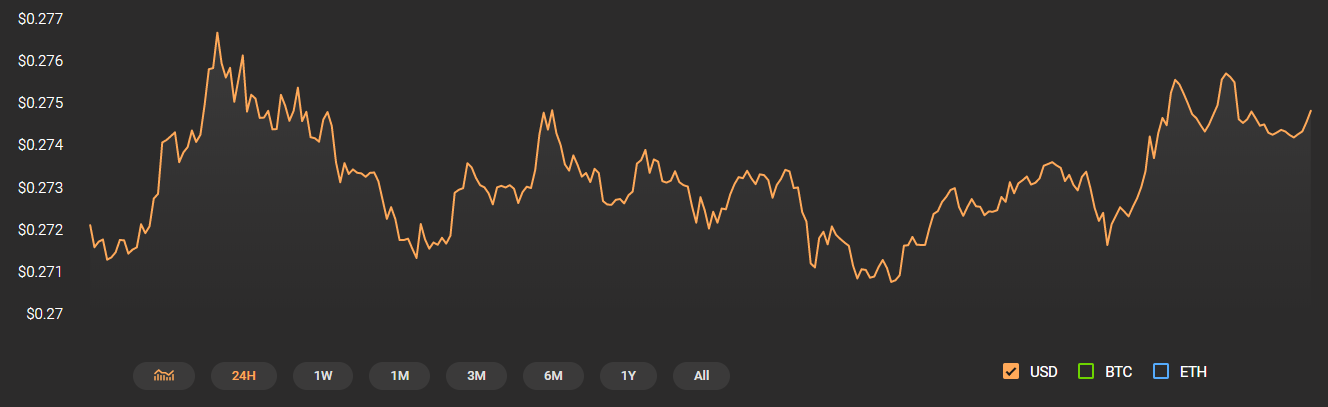
Source: CoinStats
XRP 1-hour chart:
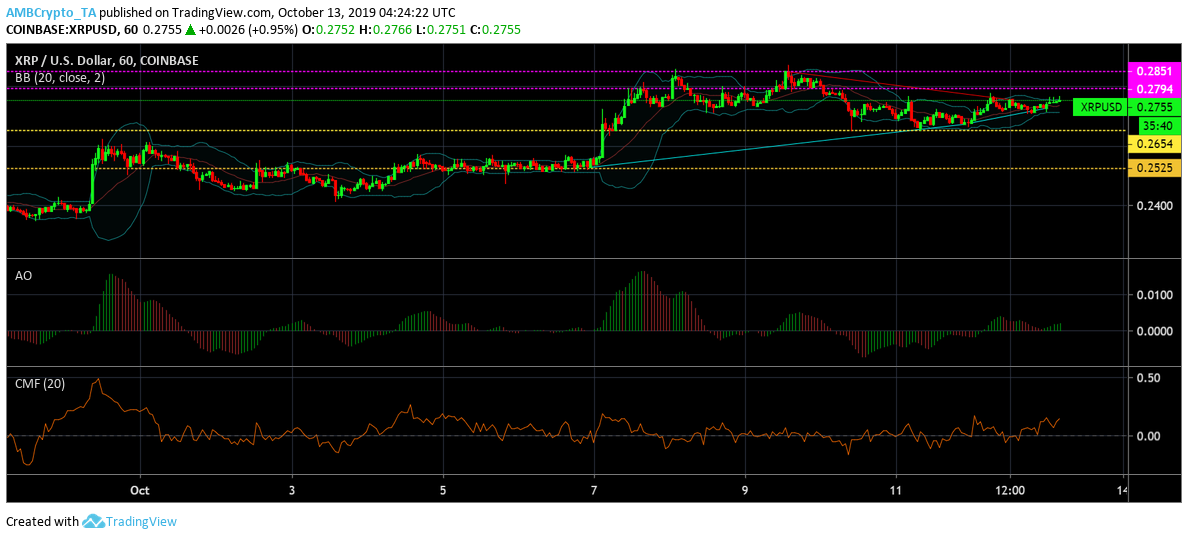
Source: XRP/USD on TradingView
XRP’s daily chart exhibited an uptrend from $0.253 to $0.264 and another uptrend from $0.267 to $0.272 following a minor correction. A downtrend from $0.285 to $0.277 was noted in the daily chart for XRP.
XRP bulls found the first major resistance at $0.279. Another point resistance for the coin remained at $0.285 while its price found supports at levels $0.265 and $0.252 respectively.
Bollinger Bands: The parallel Bollinger Bands depicted a period of stagnancy in the coin market.
Awesome Oscillator: The closing lines of the AO indicator was in green, suggesting a potential bullish phase for the coin in the near term.
Chaikin Money Flow: The CMF line was above the zero-line, this was indicative of capital flowing into the XRP market and a bullish trend in the coin’s future
XRP 1-day chart:

Source: XRP/USD on TradingView
The daily chart for XRP witnessed an uptrend from $0.292 to $0.378. A major downtrend from $0.506 to $0.362 was found in XRP’s one-day chart followed by another downtrend from $0.471 to $0.281. The coin’s immediate resistance stood at $0.320 while the support stood firm at $0.233.
Parabolic SAR: The dotted markers were above XRP candlesticks in the daily chart which indicated a bearish phase for the market.
MACD: The MACD line was above the signal line and predicted a bullish market phase for XRP
Klinger Oscillator: The KO indicator also aligned with the bulls as the signal line rested below it.
Conclusion:
The indicators for both short-term as well as long-term projected strong bullish signals despite stagnancy in the XRP market.