XRP, Cardano, Polkadot Price Analysis

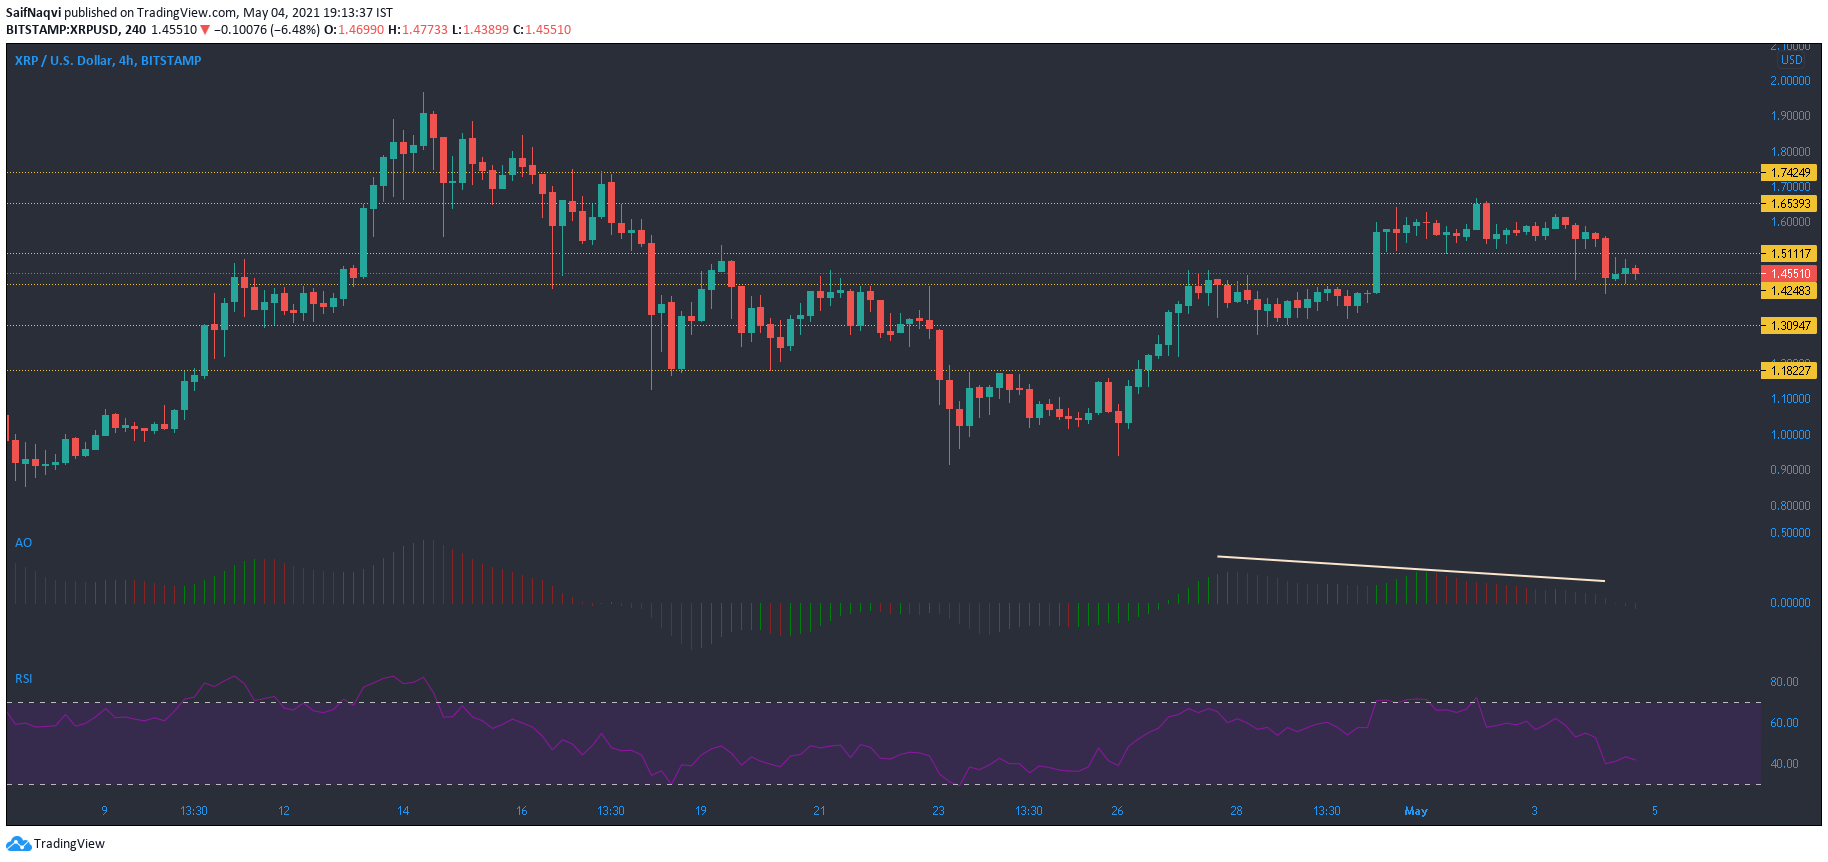
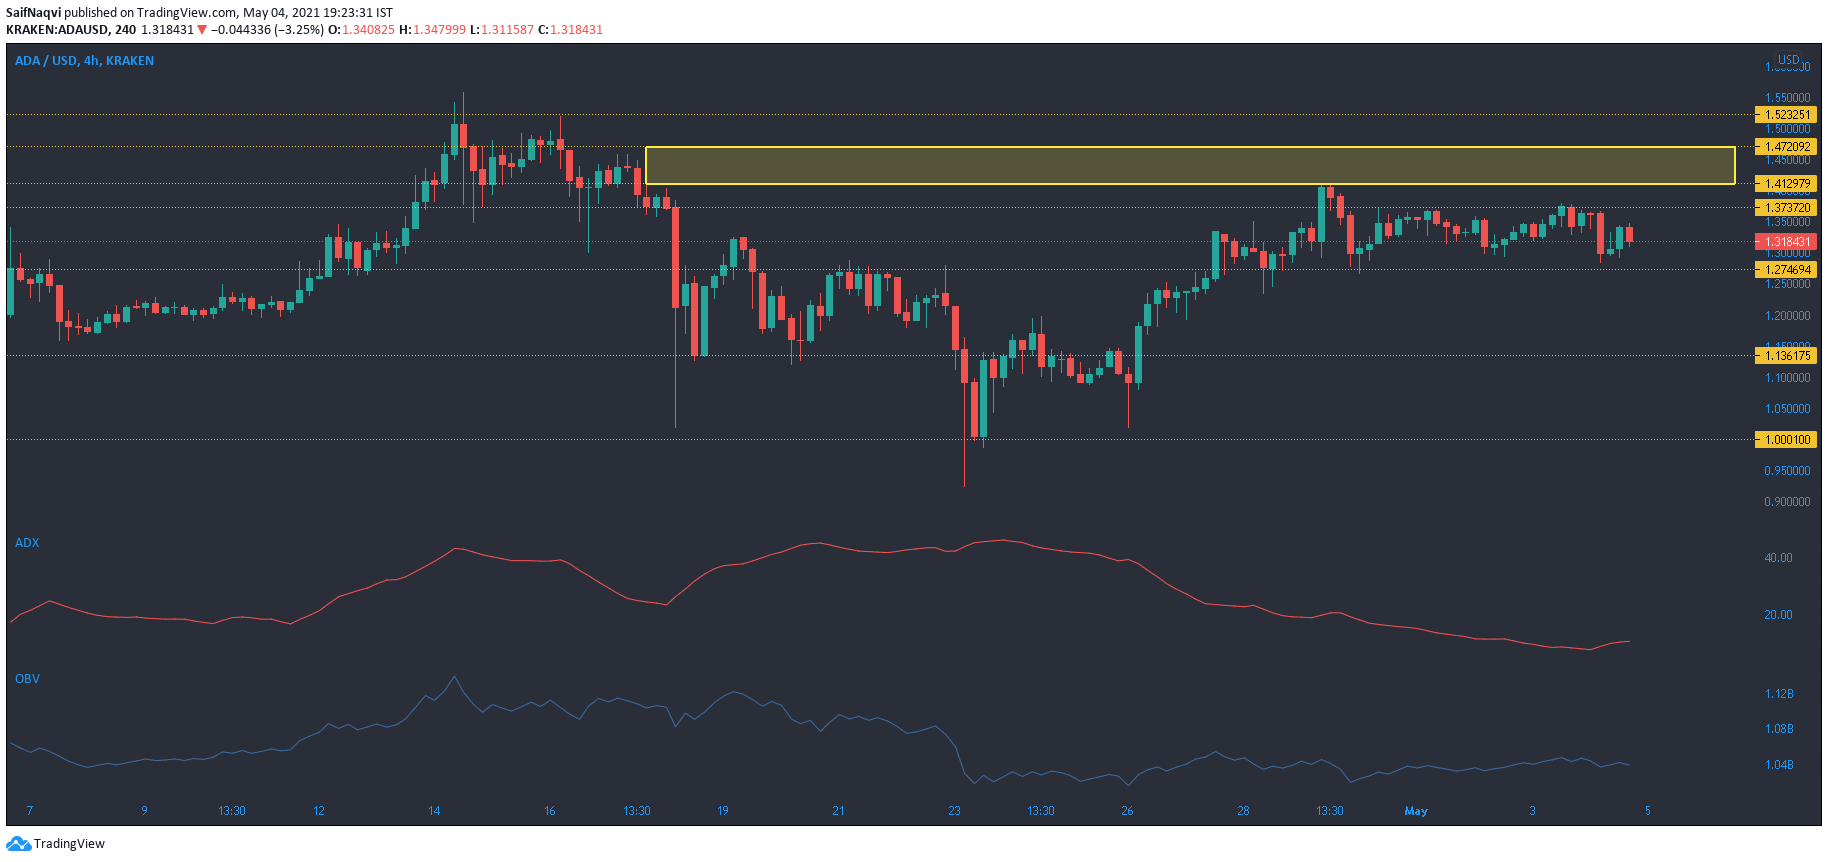
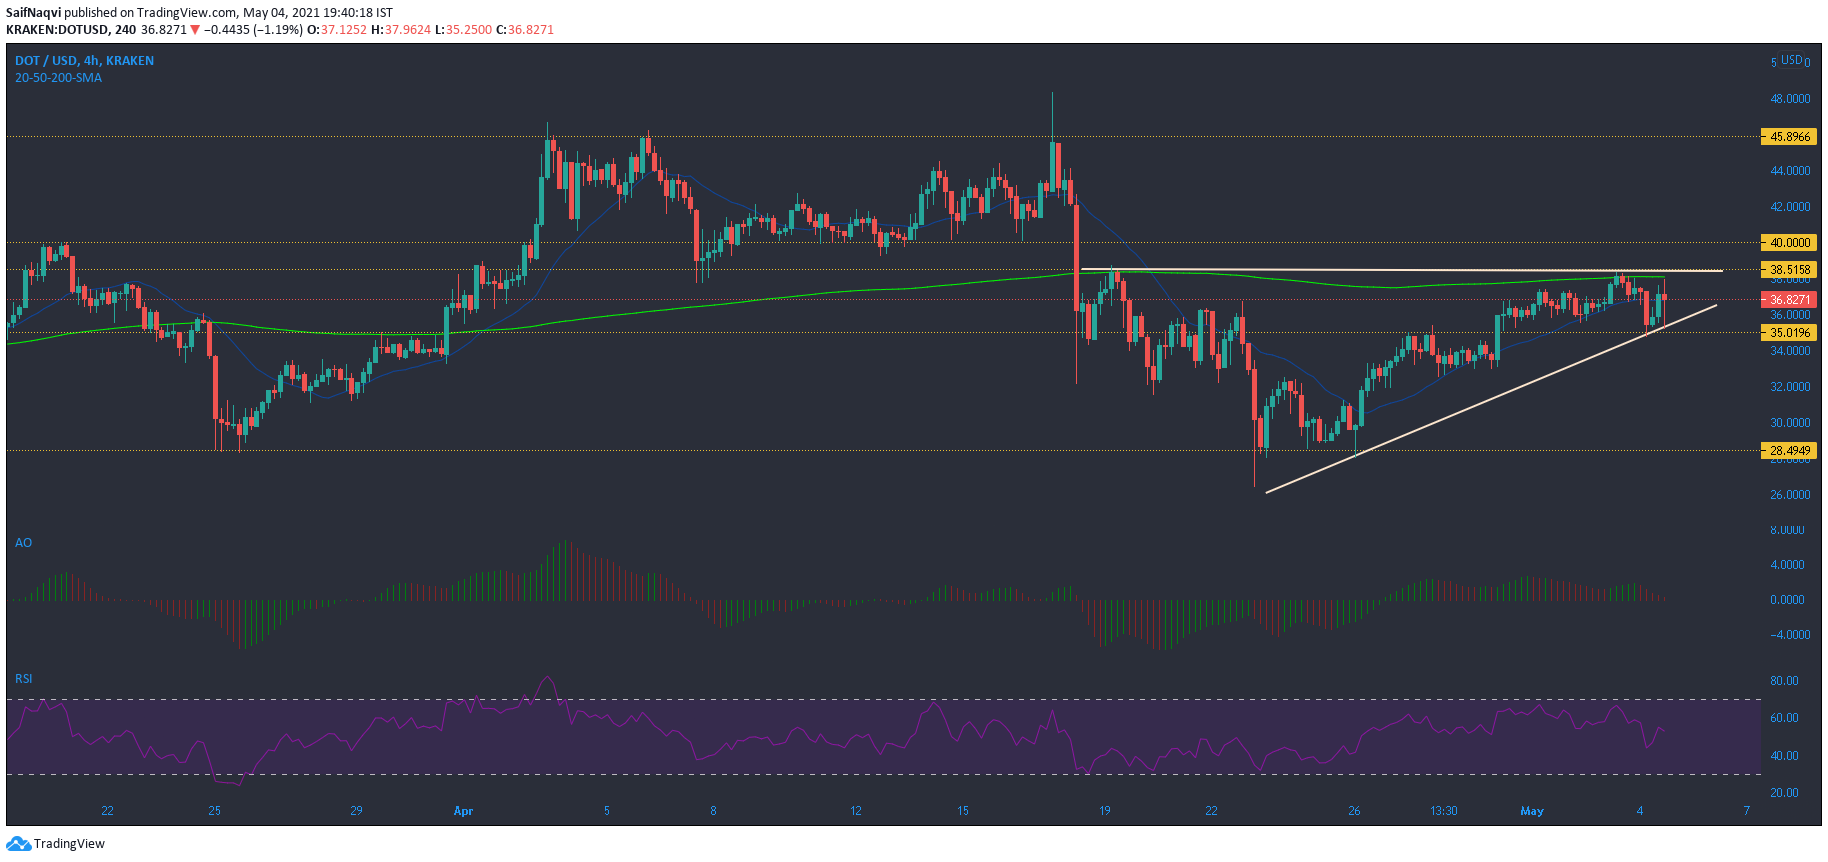
XRP highlighted bearish conditions in the market and a fall could take place all the way towards $1.30 before buyers step in. Cardano remained below $1.41-resistance and the volumes were not there yet to support a breakout. Lastly, Polkadot was predicted to rise north from an ascending triangle and head towards $40 or even $42.
XRP

Source: XRP/USD, TradingView
A bearish twin peak on Awesome Oscillator saw it move below the half-line as XRP tested $1.42-support. The hourly timeframe painted a slightly different picture, as the AO recorded some bullish momentum as opposed to the 4-hour timeframe. Over the coming sessions, the present support line must be observed as a breakdown could push XRP all the way towards $1.30 before buyers step in.
RSI was in bearish territory as well and a move towards the lower zone would lead to a breakdown on the charts. If the current support is maintained, a bullish comeback above $1.65 was a possibility.
Cardano [ADA]

Source: ADA/USD, TradingView
ADX Indicator on Cardano dropped to a low of 7 and indicated a weak trend in the market. A reading of below 25 generally indicates a degree of balance between the buyers and sellers. On the 4-hour timeframe, ADA traded between $1.37-$1.27 with weak volumes. Resistance at $1.41 could remain in focus over the coming sessions, and a successful breakout could see ADA shoot north on the charts.
However, OBV was yet to recover towards mid-April levels and the buying pressure was not there yet to support a favorable outcome.
Polkadot [DOT]

Source: DOT/USD, TradingView
The $38-38.5 range was an important area for Polkadot’s short-term trajectory. A strong resistance level lay at this point which also coincided with the 200-SMA (green). On the 4-hour timeframe, an ascending triangle was also spotted as the price made higher lows over the past week. April 20 saw a negative crossover between the 200-SMA and 20-SMA, which led to a bear market. If the price breaks above the upper trendline of the pattern, the 50-SMA could move back above the 200-SMA and this could boost a recovery in the market.
However, the lower trendline needed to be defended from some bearish pressure before a breakout took place. Awesome Oscillator registered a series of red bars as momentum rested with the sellers. RSI pointed south from 55 and reflected a more balanced market. In the event of a breakout, the first and second targets lay and $40 and $42, respectively.


