Although the short-term market of cryptocurrencies has welcomed the bears, the long-term market appeared to be holding strong. Altcoins like XRP, Cosmos, and VeChain have been among those alts trying to ward off the market’s bearishness. However, it will become increasingly difficult if Bitcoin’s press time trajectory continues.
XRP
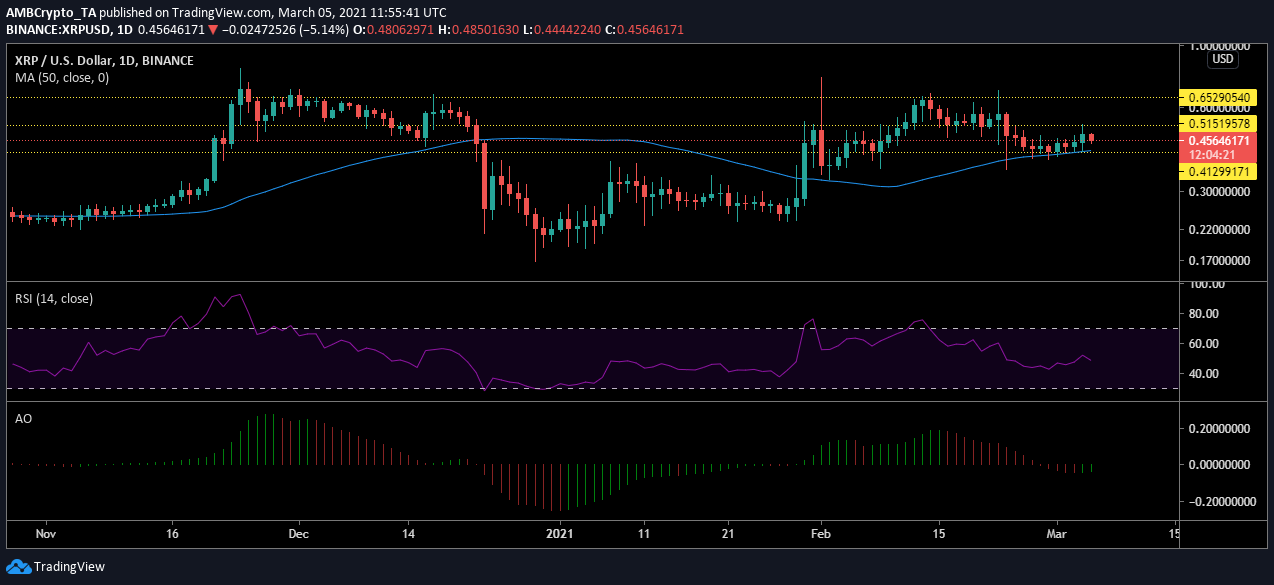
Source: XRPUSD on TradingView
XRP moved on to the seventh position on CoinMarketCap’s rankings with a market cap of $20.58 billion. The attached chart indicated that the altcoin’s price had managed to hold on above the $0.4129-support. At the time of writing, the digital asset was trading at $0.4576 as it bounced off its support level. It was moving towards the resistance at $0.5151 and may try to breach it.
The overall trend in the market was pointing towards a brief consolidation phase that XRP’s market can enter. The 50 moving average remained under the candles noting the upwards trending price. However, there wasn’t enough buying pressure as the Relative Strength Index remained at the equilibrium zone. This indicated that the buying and the selling pressures were getting evened out.
Meanwhile, the momentum in the market dropped into the negative zone, suggesting that a price swing was difficult to achieve at this time.
Cosmos [ATOM]
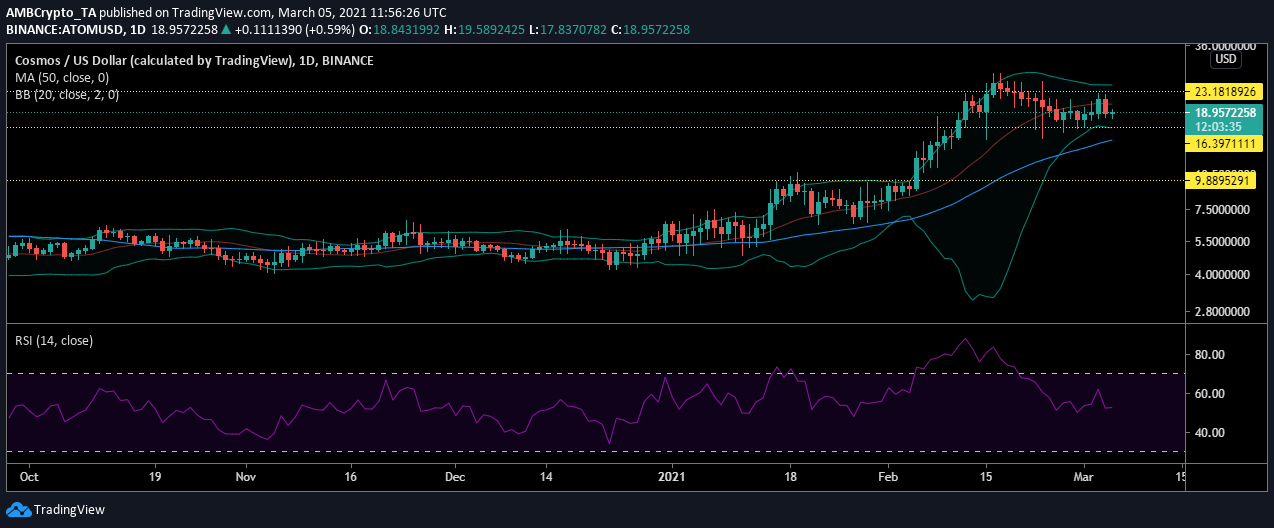
Source: ATOMUSD on TradingView
Cosmos’s market has been underlining a sudden surge in the value of the digital asset since the beginning of February. ATOM’s value hiked above $9.88 and peaked at $27.52. However, the altcoin saw minor corrections after the peak and was trading at $19.08, at press time.
The cryptocurrency’s price also moved within the $23 and $16-range. However, the crypto-market was indicating that the volatility had pushed the bears into the market. The Bollinger Bands were converging after a vast volatility period and due to the same, the alt’s price may move within the aforementioned range in the long-term.
Meanwhile, the Relative Strength Index also affirmed that the market was going to move at the current level since the buying and the selling pressures had been equalized.
VeChain [VET]
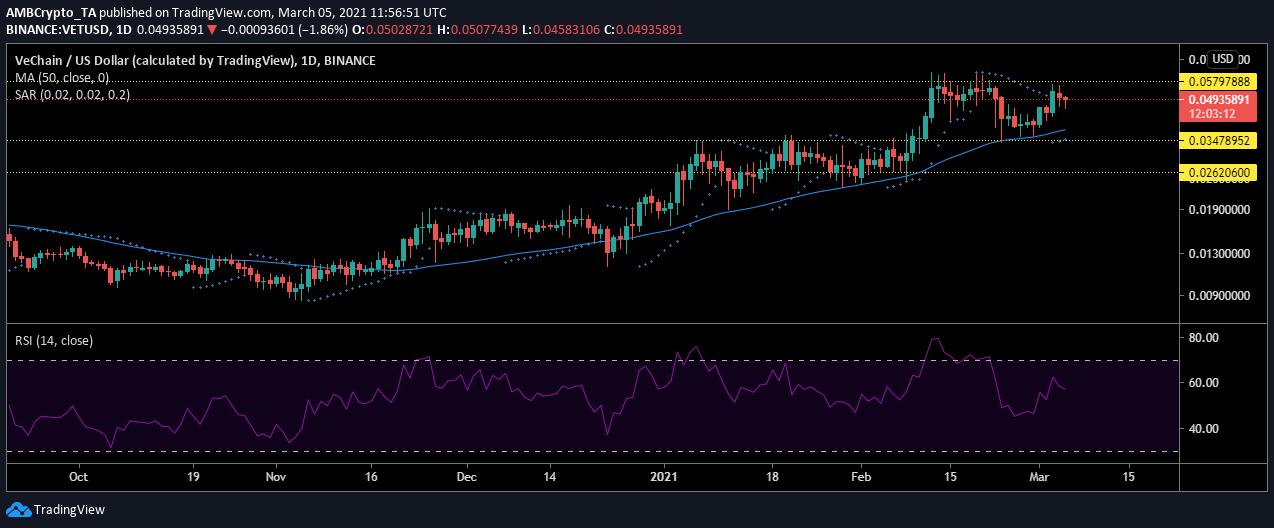
Source: VETUSD on TradingView
VeChain’s market has been noting tremendous volatility over the past few weeks. With a sudden pop in value, the crypto-asset hit the resistance level at $0.0579. However, it immediately reversed itself. At the time of writing, the crypto-asset was trading at $0.0500.
Irrespective of the market volatility, VET was showing signs that the bulls were still in charge. The 50 moving average aligned under the candles along with the markers of the Parabolic SAR indicator. These were signs of an upward trending market.
On the contrary, the Relative Strength Index remained close to the equilibrium zone, before climbing towards the oversold zone. This meant that the market’s bulls were taking care of the altcoin’s surging price.