
Why Solana’s $300 target hinges on breaking THIS resistance
Analysis

XRP crashed right through the $0.7-level; here’s where buyers can step in
Posted:
| Last updated: January 30th, 2024
Journalist

Disclaimer: The findings of the following analysis are the sole opinions of the writer and should not be considered investment advice
On the daily timeframe, XRP looked strongly bearish. The $0.77-area was one where a support level lay and was expected to see some demand arrive. Some demand was seen, but nowhere near close enough to stop the mounting selling pressure.
The next area of demand lay at $0.51. Could XRP see a bounce from this area?
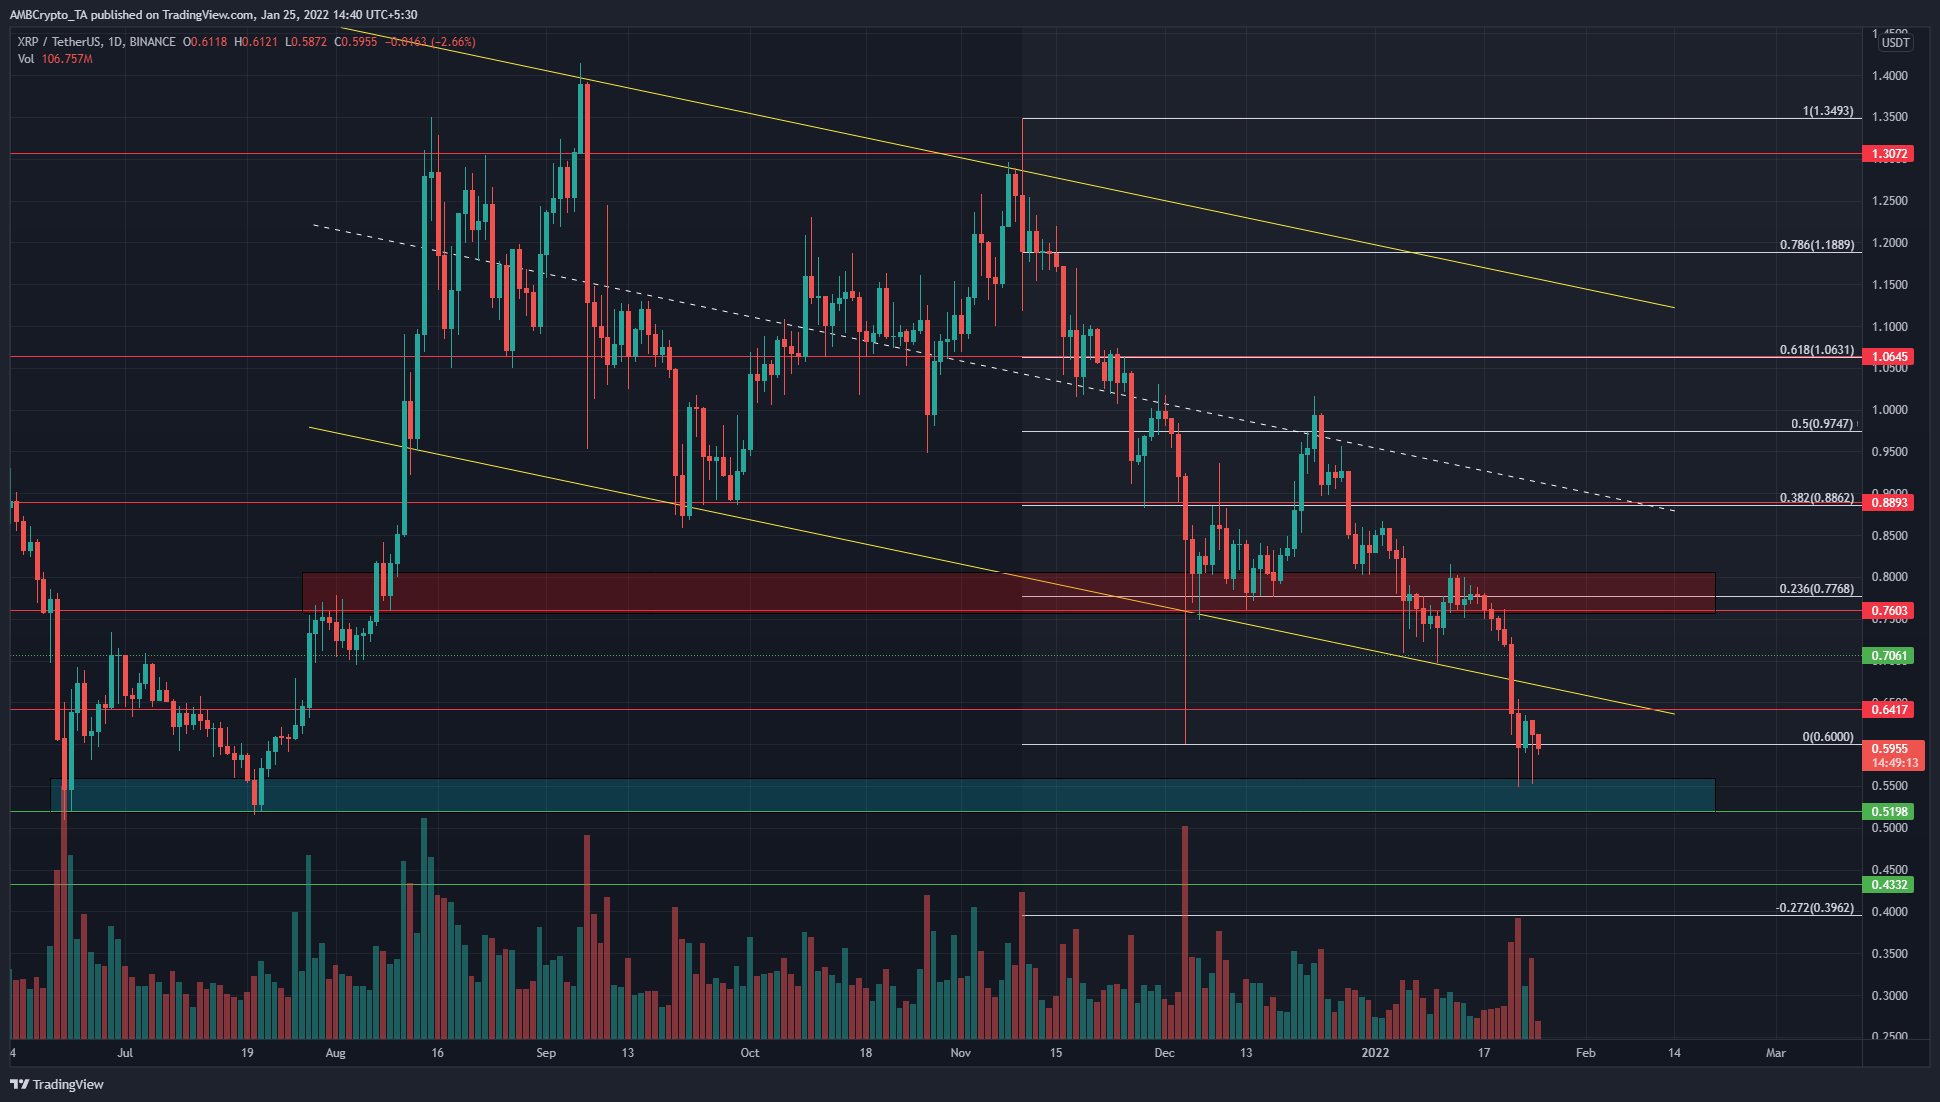
Source: XRP/USDT on TradingView
XRP’s move from the $1.34 swing high to the $0.6 drop in December was used to plot a set of Fibonacci retracement levels (white). The price bounced from this area in December to $1, but was rejected.
A retest of the $0.77-demand area saw the price slip below it and flip it to an area of supply. Since then, the month of January has seen steady losses. The market structure continued to be a bearish one.
The 27% extension level, based on the aforementioned set of Fibonacci levels, lay at $0.39. This level represents an area where a move below $0.6 (100% of the previous move) can find relief at. However, the $0.51 area has seen a bullish order block form in July earlier in 2021. A similar bullish reaction could manifest once again. However, the trend would remain bearish.
The price has fallen under a channel (yellow) whose mid-point has acted as resistance as well in December. The lows of this channel could act as supply, which means that the $0.64-$0.7 zone could be a supply area in the weeks to come.
Rationale

Source: XRP/USDT on TradingView
The daily RSI has stayed above 30 for most of the past six or seven months, with brief drops lower. The most recent sell-off for XRP fell as low as 23.1 and retested 30 as resistance. A relief rally can be expected, but it need not be a sustained rally.
Even though the price was at $0.6, the Stochastic RSI was climbing once more. The indicator appeared to be gathering steam for another drop.
The OBV has been on a downtrend since September, alongside the trend of the price.
Conclusion
The trend and the market structure for XRP were decidedly bearish. A support level of $0.51 can act as an area of demand, while the $0.64-0.7 area could be retested as an area of supply. A move back above $0.7 and $0.77 would be needed to break the bearish structure.


