XRP descends to a support zone, but will the volatility ruin trader profits

Disclaimer: The findings of the following analysis are the sole opinions of the writer and should not be considered investment advice.
Uncertainty in global markets and the threat of rising inflation meant that the market sentiment has been fearful over the past week. On 19 September, Bitcoin [BTC] saw a bounce from the $18.4k and retested the $19.6k resistance.
XRP also stood near a pivotal support zone that did not offer any resistance on the previous trading day. Could this zone withstand the selling pressure, or will it give way once again?
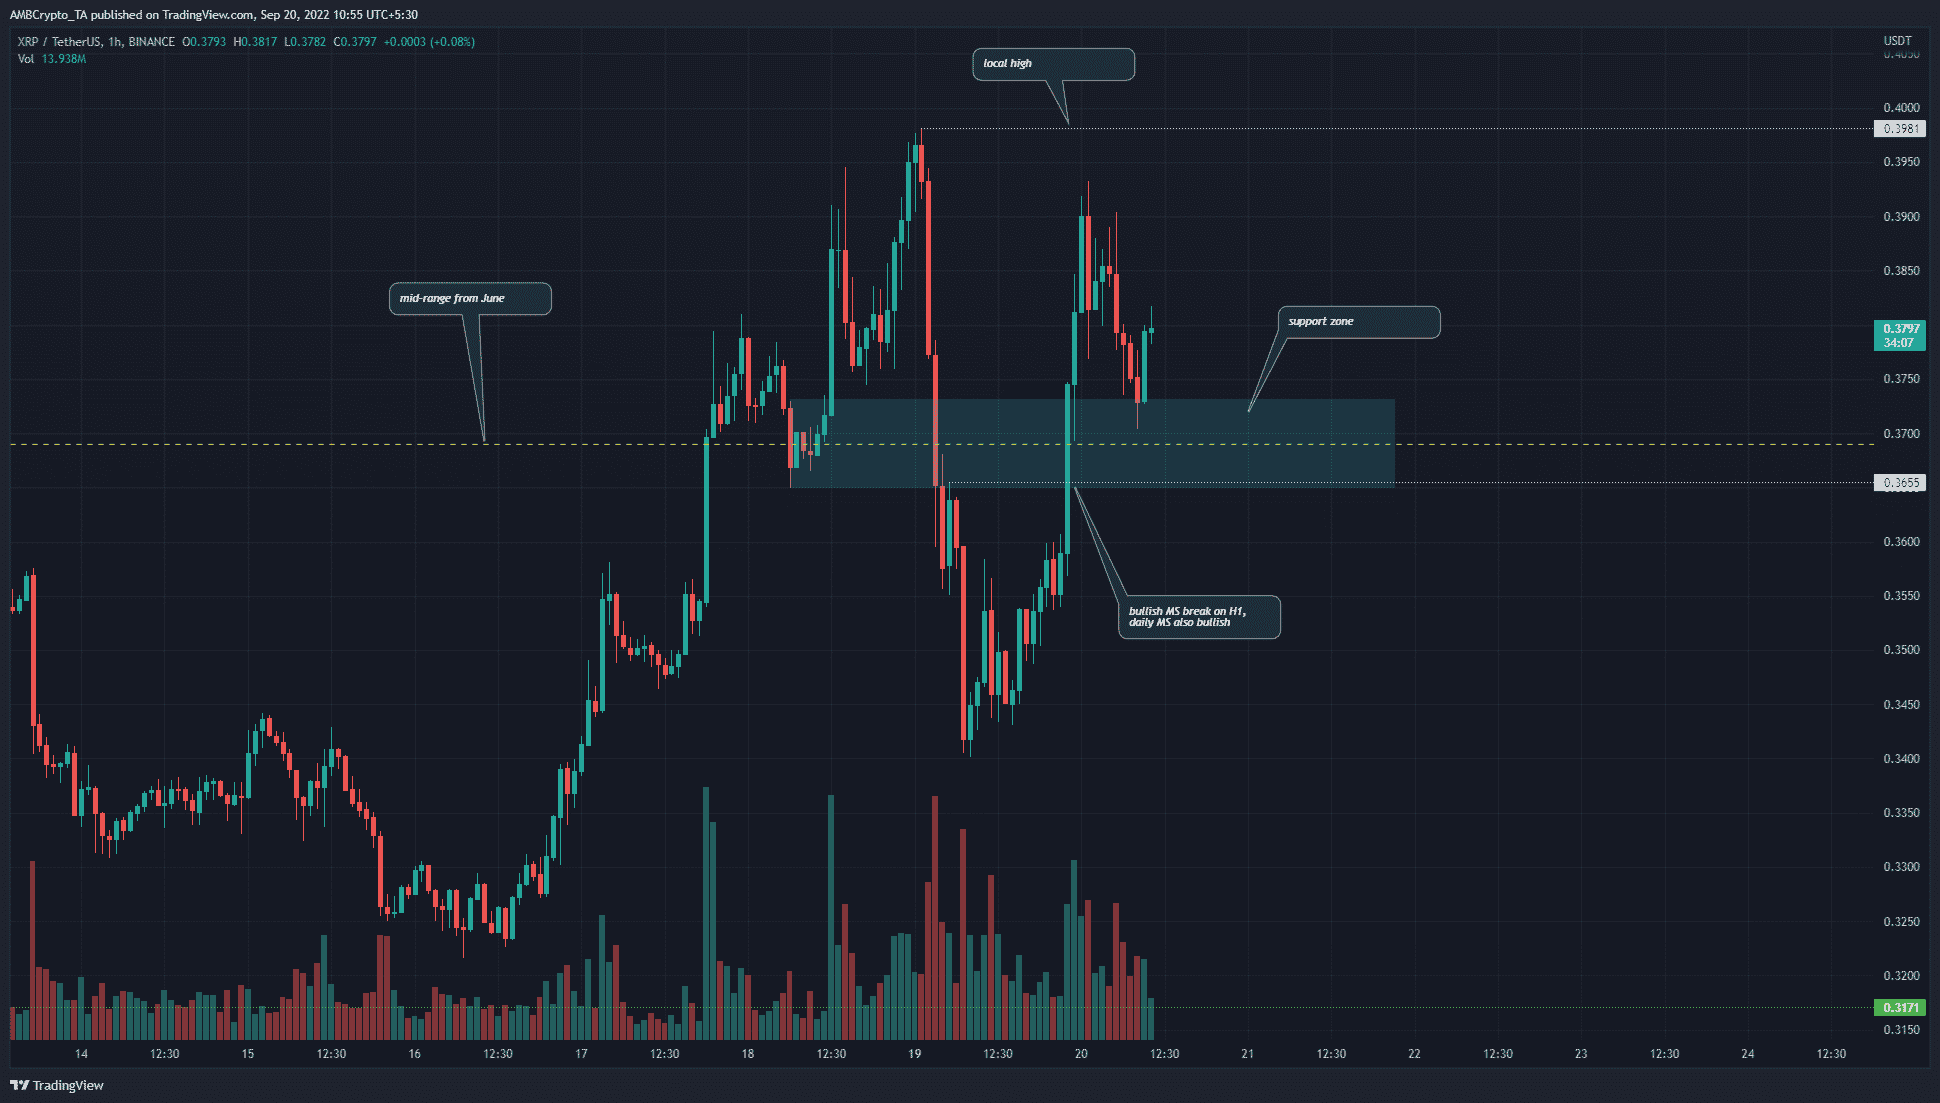
XRP- 1-Hour Chart
Sometimes, weekends have heightened volatility levels because liquidity might be lesser during weekends. Fewer active traders could lead to thinner order books that struggle to absorb high volume buy or sell orders.
On 18 September, the price leaped upward to $0.398 before taking a turn to the bearish side. The subsequent plunge went as low as $0.34 before 19 September saw some recovery to reach $0.39 again.
These moves happened right around the mid-range value at $0.369 (dashed yellow). This range has been in play for XRP since June and extended from $0.426 to $0.312. The mid-range has been a key level on the higher timeframes.
On the hourly timeframe, the move above $0.3655 (dotted white) flipped the H1 market structure from bearish to bullish. Moreover, despite recent volatility, the daily time frame also has a bullish bias over the past two weeks.
Rationale
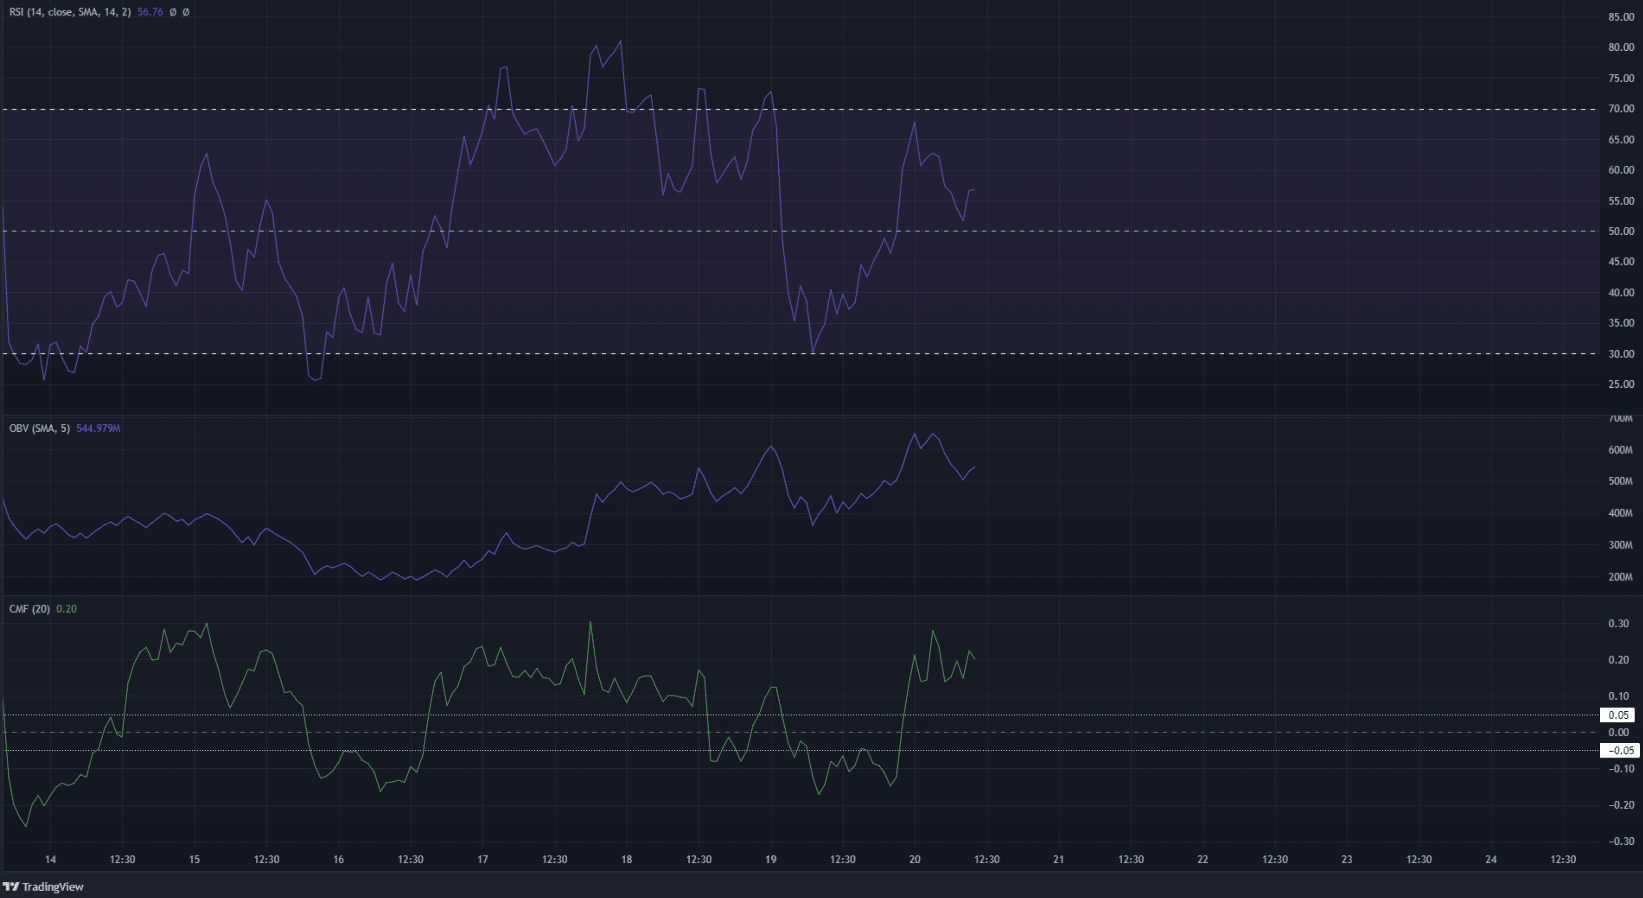
The Relative Strength Index (RSI) stayed above neutral 50 to show bullish momentum. It also bounced from just above the 50 mark in the past couple of hours of trading. The On-Balance Volume (OBV) was on an uptrend as well as it posted higher lows over the past few days.
The Chaikin Money Flow (CMF) had dipped below -0.05 on 19 September to signal heavy capital flow out of the market. However, this has reversed as XRP bounced from the $0.34 lows, according to the indicator. It was back above +0.05 to show buying pressure behind XRP.
Conclusion
A retest of the support zone (cyan) could see a bullish reaction for XRP targeting local highs and range highs. Invalidation of the idea would be a drop back below the mid-range mark. Hence, buy orders in the support zone can set their stop losses below the $0.365 mark. The lower timeframe indicators had a bullish bias. Bitcoin was at the $19.6k local resistance, and a rejection could also push XRP lower.