XRP, Dogecoin, Cardano Price Analysis: 13 June

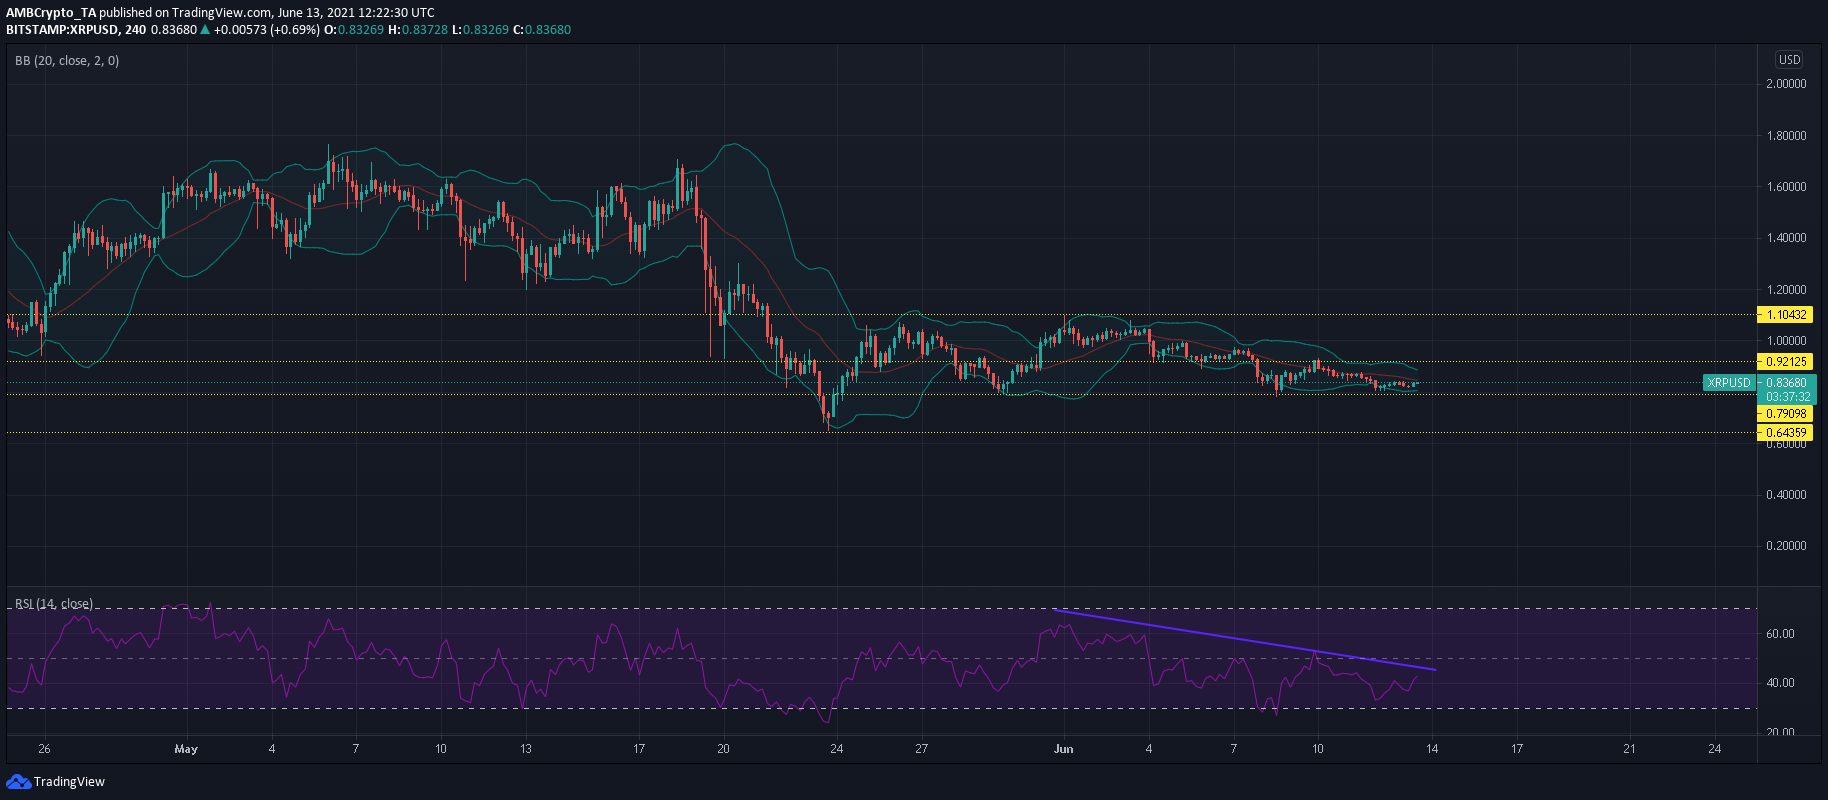
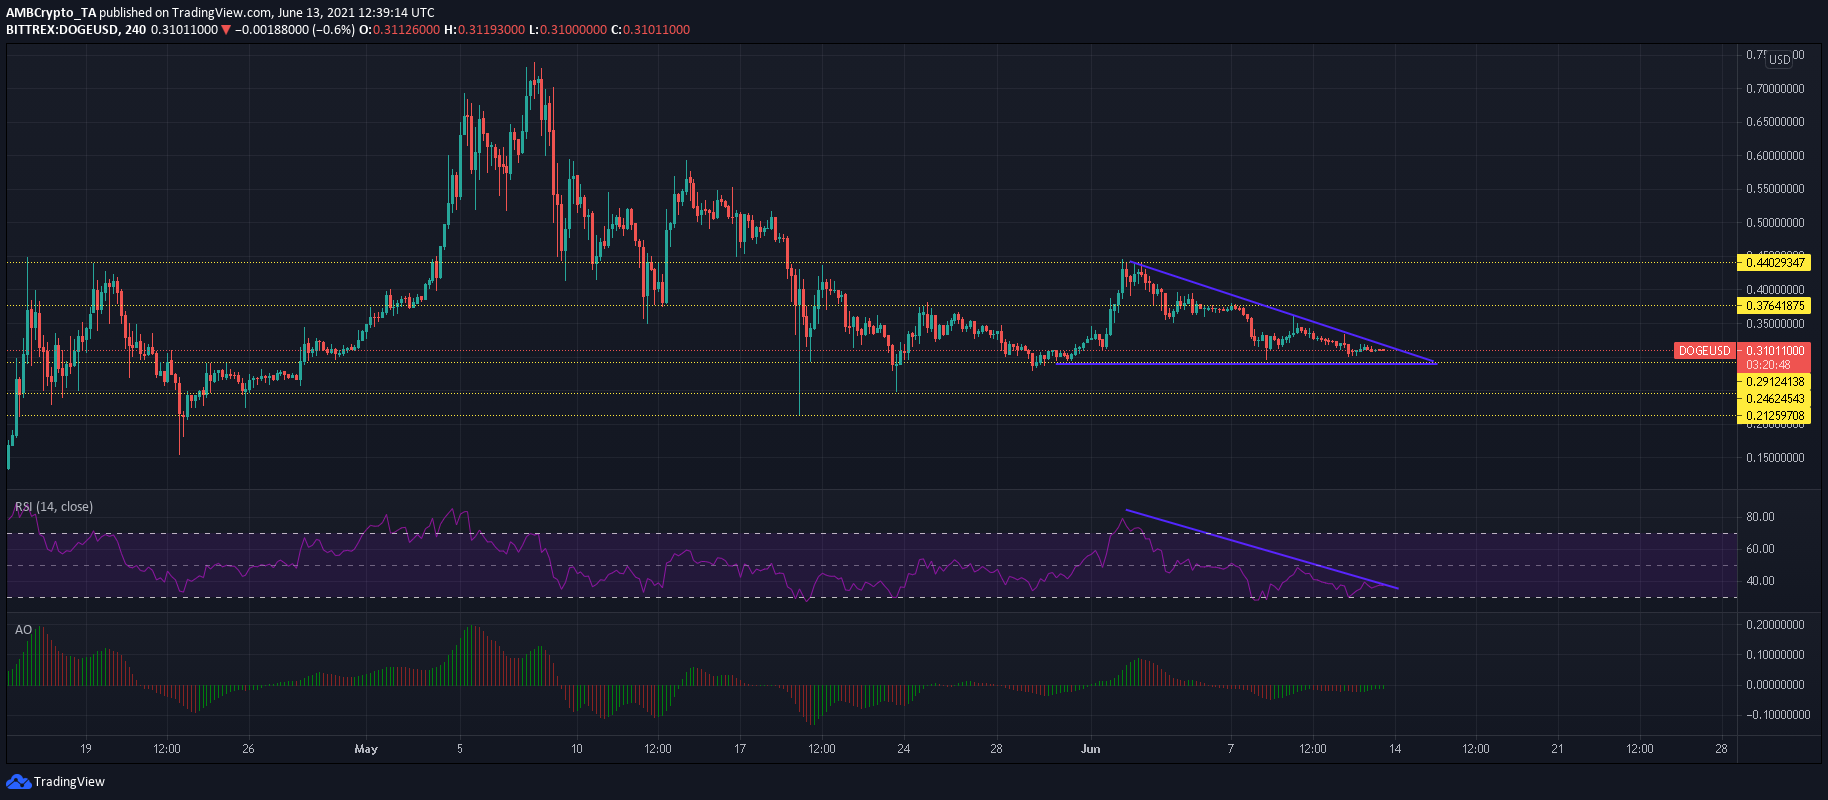
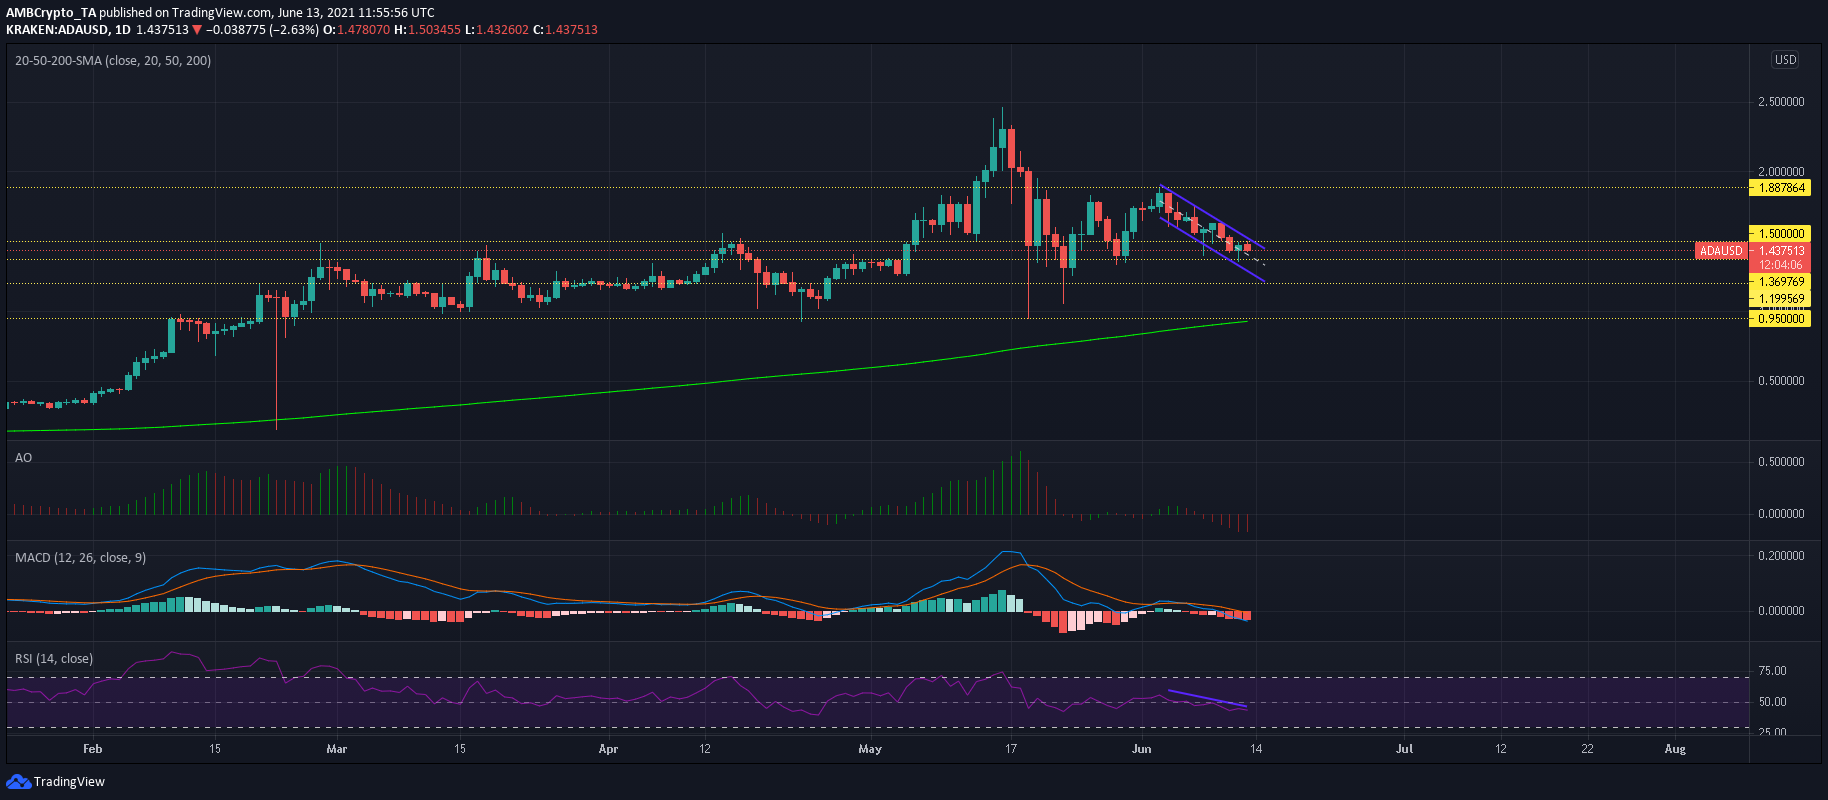
XRP’s short-term movement projected sideways movement $0.921 and $0.790 with chances of a breakout. Dogecoin remained exposed to a 26% decline in case of a move below $0.29. Finally, ADA eyed additional losses over the coming sessions.
XRP

Source: XRP/USD, TradingView
While XRP’s long-term trajectory remained bullish and a rise towards the $1-mark seemed likely, its short-term prediction was more repressed. Bollinger Bands’ constricted nature represented consolidation within XRP’s current channel of $0.921 and $0.790. Barring strong cues from the broader market, XRP would likely maintain its channel over the coming sessions.
Lower highs on RSI indicated weakness in the market. Focus should be on this index as it approached its next leg towards the neutral zone. A move above 50-60 would be a sign of bullish strength and the same could trigger a breakout above XRP’s press-time resistance.
Dogecoin [DOGE]

Source: DOGE/USD, TradingView
Dogecoin held above its 20th May swing low of $0.29 and had some more leeway in case of further dips. However, bulls must be wary of a break below $0.29 as this formed the base of a descending triangle. A breakdown could result in a 26% retracement towards 19 May low of $0.21.
RSI’s downtrend suggested bearish control over the last ten days. The index was expected to bounce south after touching its upper trendline and head towards the oversold region once again. There was some bullish momentum on the Awesome Oscillator and a move above half-line would assist bulls in a breakout attempt, which would invalidate DOGE’s bearish pattern.
Cardano [ADA]

Source: ADA/USD, TradingView
Cardano’s down channel emerged after the price got rejected at $1.88 resistance. The pattern was yet to reach its turning point and ADA would likely see more losses over the coming sessions before a bounce back. EMA Ribbons moved above the candlesticks as a bearish trend was still in play. The bands slightly diverged at press time and indicated a strengthening trend.
RSI also formed lower highs and was expected to touch the oversold zone once again before reversing trajectory. A delayed stay in the bottom zone could drag ADA all the way towards its 19 May low of $0.95.


